On April 16, 2014, LNS Research and MESA International held a webcast event entitled, “2013-2014 Manufacturing Metrics that Really Matter.” By the end of the event, we had received a barrage of questions from attendees, many of which couldn’t be addressed live due to time. In this post, we’ll address the top 10 questions that were asked.
For readers who weren’t able to attend the webcast, here’s some background information. This was a joint research project conducted with MESA International from October 2013 to February 2014 focused on identifying the metrics that are driving the most business value for manufacturers today as well as best practices for supporting optimized metrics programs.
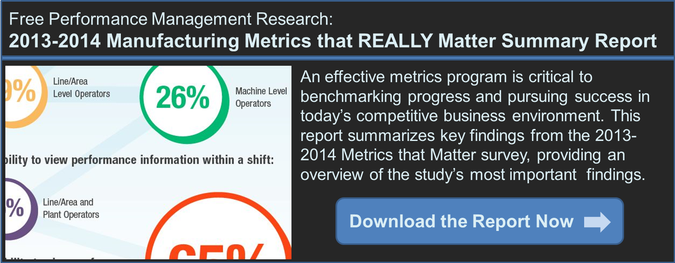
The webcast highlighted the average performance improvements that companies are experiencing today across eight metrics categories, as well as key correlations between operational and financial metrics, trends around role-based dashboards and metric visibility, and how the use of Manufacturing Operations Management (MOM) software applications is supporting and impacting these metrics programs today.
Questions and Answers
The webcast covered the highlights of some truly detailed, data-packed findings. Since the hour time constraint kept us from taking as deep a dive as we wanted into these topics, and from addressing the multitude of questions that came our way, we will address some of the most popular below:
Q1: How do you define a successful New Product Introduction (NPI)?
A: In the actual survey, we asked about percent of successful NPIs. Survey respondents were able to use their own company definitions of success, as we did not provide a standard definition as part of the survey questionnaire. We do know from experience, however, that not all new product introductions hit the mark on key issues that relate to successful NPIs that include: time to market, time to volume, first pass yield/quality or target costs. These are the primary items that we see most companies focused on for defining their success.
Q2: Which findings did you find most compelling, that will prompt follow-up research?
A: We found the strong correlations between specific MOM software application use and (up to 2x) average annual metric improvements to be quite compelling. Overall, 85% also have process improvement programs in place such as ISO 9000/9001, Lean Manufacturing, Six Sigma, Operational Excellence, etc. This proves the powerful combination of process improvements that are enforced and made rapidly visible using software. From a follow-up perspective, LNS Research is continuing to research what is standing in the way of further technology adoption, along with the impact of new technologies and associated strategies.
Q3: What currently defines "average?" Is it a single metric, or performance across several?
A: We looked at both. There were 25 individual metrics that average annual improvements were provided by survey respondents. We then grouped and averaged these metrics into eight categories, that included Financial metrics, and seven Operational metric categories: Inventory, Innovation, Responsiveness, Efficiency, Quality, Maintenance and Compliance.
Q4: Which Operational metrics are having the most impact on financial/business performance?
A: The key categories of Operational metrics that had the biggest impact on average annual improvements in financial/business performance were: Inventory, Efficiency, Quality and Responsiveness. Successful NPI's and OEE (Overall Equipment Effectiveness) were among the top individual metrics that contributed to positive financial/business performance. The detailed numbers behind all of these are in the full eBook report.
Q5: Interesting to note the average annual improvements related to the use of Operations Intelligence/Enterprise Manufacturing Intelligence (OI/EMI) solutions. How were the characteristics of those solutions defined?
A: Survey respondents were able to use their own company definitions of OI/EMI, as we did not provide a standard definition as part of the survey questionnaire. We did list OI/EMI among other related and popular manufacturing applications such ERP, Business Intelligence (BI), Manufacturing Execution Systems (MES), and Data Historians. Therefore, OI/EMI represented a distinct category of software offerings. In the webcast, we also presented data from the survey that represented the functionality deployed for role-based dashboards, which described specific OI/EMI functionality. Functionality included plant to enterprise scope of information, drill downs, and alerts on metric variations.
Q6: Reference was made to a split between companies that will take advantage of 'big data' on the business vs. the manufacturing side. What is the delta on the two usages?
A: The context of the survey question was to uncover future anticipated uses and applications of big data as opposed to existing use. We specifically asked about manufacturing/plant big data and enterprise big data. Only 6% of respondents thought their organizations would NOT use manufacturing/plant big data, and only 5% of respondents thought that their organizations would NOT use enterprise big data. Therefore, respondents were confident that BOTH would be used into the future.
Q7: Regarding the impact on OEE, which factor (quality, performance, or availability) was most affected?
A: In the survey, we did not look at impacts on the components of OEE, but we did look at the impact of OEE improvements on average annual Financial results, as well as other quality and availability metrics on average annual financial results. A key related observation: those with OEE of 80 or better (the top 11% of respondents) had average Financial improvements of 14%.
Q8: What % of respondents indicated that they are planning to implement mobile technologies into their facilities?
A: 75% expressed a range of expected users and applications for mobile technologies. Only 25% stated that they did not know.
Q9: Are manufacturers using benchmarking software to gauge their performance in the marketplace?
A: 38% of respondents are using dashboard software to benchmark and compare their internal metric performance, however, in the survey we did not ask about the use of benchmarking software to compare externally.
Q10: How do I get access to additional details from this metrics research?
A: If you are a MESA Premium member, the full eBook report is available to you from the MESA resource website. You can also participate in LNS Research's social research model, and in exchange for taking the survey, you will gain access to the eBook and other valuable reports on the LNS Research Performance Management library by clicking below.