.
Industrial productivity growth is the single best measure of profitable value creation.
Sustained industrial productivity growth indicates an ability to drive improvements across the end-to-end value chain, including product design, supplier relationships, manufacturing operations, engineering, supply chain management, and customer service.
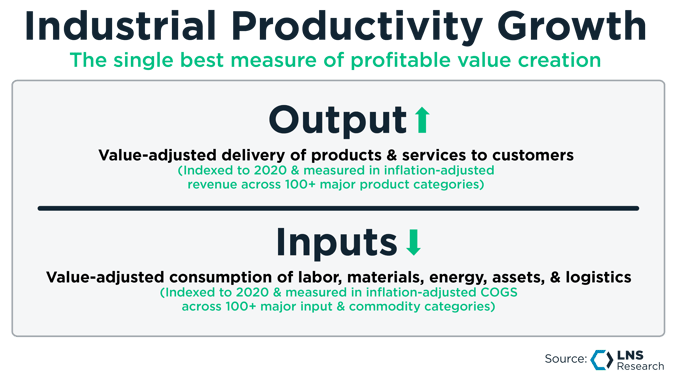
Figure 1 — Industrial Productivity Growth Ratio — Inputs to Outputs
LNS Research defines industrial productivity growth as a positive change in the ratio of output to inputs, where outputs are the value-adjusted delivery of products and services to customers and inputs are the value-adjusted consumption of labor, materials, energy, assets, and logistics used to deliver those products and services to customers.
While the concept is straightforward, accurately measuring input and output quantities is complex.
There is no way to directly measure these operational quantities accurately across even a single company, never mind the entire economy. However, there is a way to indirectly measure the changes to these operational quantities through financial data.
To calculate industrial productivity growth in the world of operations, there are three pieces of required financial data:
Using financial data, we can use dollars as a common unit across all output and input categories. Then, when we can control for and back out average price changes year over year across all categories, all that remains are real-world operational changes to the value-adjusted quantity of outputs and inputs.
Does that make your brain hurt? A simple example might help…
The LNS Research Lemonade Stand
In the summer of 2020, LNS Research launched a lemonade stand. Like any business, it has been focused on improving operations over the past five years. It has generally become more productive across input categories, except in labor productivity, where there has been significant turnover.
There has also been a significant price increase across all input categories, including the ultimate price of lemonade.
Explore our interactive operational and financial data in this spreadsheet to better understand the relationship between operational data, financial data, industrial productivity, and margin. You can change the blue and white cells in the “operational ratios” and “financial ratios” tabs to control productivity by input type and prices by category.
-
-
-
Note how when you change prices on the “financial ratios” tab but hold productivity by input category constant on the “operational ratios” tab, overall industrial productivity stays constant, but margin changes on the “Industrial Productivity Index” tab.
-
Next, note how when you change productivity ratios for input categories on the “operational ratios” tab but hold prices on the “financial ratios” constant, both industrial productivity and margin change on the “Industrial Productivity Index” tab.
The Industrial Productivity Index — From One Company to 380 Companies
In 2022, LNS Research laid the foundation for a new way to benchmark productivity across the industrial sector. At the heart of this effort is the Industrial Productivity Index (IPI), a bottom-up and standardized measure of how well companies convert inputs (like labor, materials, and energy) into outputs (like products and services).
As a first-of-its-kind measure, the Industrial Productivity Index addresses several longstanding challenges in measuring industrial productivity, including inconsistent definitions, lack of standardized data, and geographic limitations.
The Industrial Productivity Index consists of 10 industries and 380 companies at its base. We assign each company to an industry, sub-industry, and product category and estimate the inputs and outputs across all these categories. One classic example is General Mills, best known for cereal but now with products across many food categories.
A Real-World Example of Calculating IPI: General Mills
We begin with General Mills' financial data for a particular year, let’s say, 2024. To that, we apply producer price indices for General Mills’ product categories to account for price changes. It is important to note that the price changes were not made at the overall food industry level but were calculated as a weighted average based on the contribution of each of its product categories.
General Mills product categories:
-
Breakfast cereal: (Approx. 20% of revenue)
-
Snacks, packaged food, and confectionery: (Approx. 50% of revenue)
-
Output: Fruit and Vegetable Preserving, Specialty Food, Sugar and Confectionery Products, Other Snack Foods
-
Input: Farm Product Commodities (Fruits and Melons, Fresh/Dry Vegetables, and Nuts), Farm Product Commodities (Grains), Flavoring Syrup, and Concentrate
-
Pet food: (Approx. 10% of revenue)
-
Output: Animal Food
-
Input: Animal Slaughtering and Processing, Farm Product Commodities (Grains), Fruit and Vegetable Preserving, Specialty Food
-
Dairy products: (Approx. 10% of revenue)
-
Food service and other: (Approx. 10% of revenue)
*Product category breakdowns are estimated based on publicly available information
We adjust General Mills’ 2024 revenue by a weighted average of the output prices and COGS by a weighted average of the input prices for each product category. After this, we account for additional inputs like assets, energy, labor, packaging, etc., and then divide this adjusted revenue by the adjusted COGS to give General Mills’ productivity number. This number is then indexed to its 2020 counterpart to get the final Industrial Productivity Index for 2024.
After we complete one company, we repeat the exercise across all 380 companies and 10 industries and weight them by revenue to form the full Industrial Productivity Index. This allows us to see how industrial productivity changes across industries and particular companies.
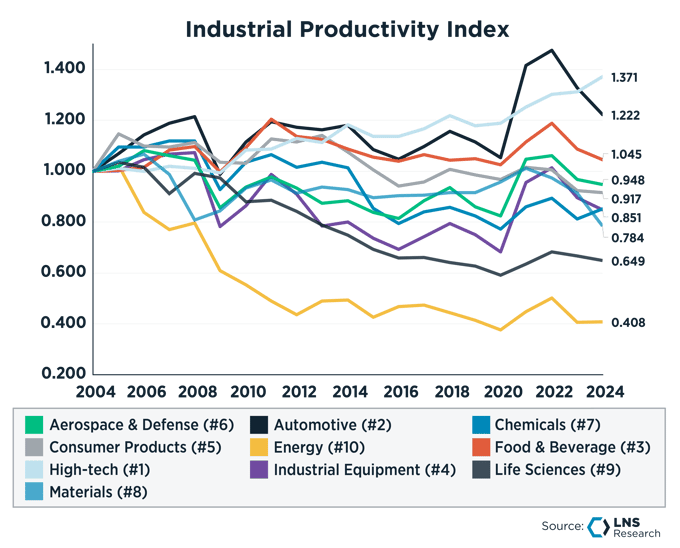
Figure 2 — LNS Research Industrial Productivity Index™
Productivity Pathfinders: The World’s Most Productive Companies
Now that we have a measure of productivity across industries, the next natural question is how individual companies perform and what they do differently to drive this performance.
We call the top-performing companies in the IPI "Productivity Pathfinders.™" We believe productivity growth is a long-term measure and, as such, look back over the past six years to identify the best of the best. To be a Pathfinder, you must have been in the top half of industry performers from three to six years ago, and you must be in the top three of your industry performers over the past three years.
When we examine Pathfinders as a group, we find that they outperform their competitors across many important metrics. Still, most notably, they do so on Operating Margin, free Cash Flow, and, to a lesser extent, revenue. Pathfinder companies have found the secret to generating long-term, profitable revenue growth: improving industrial productivity.
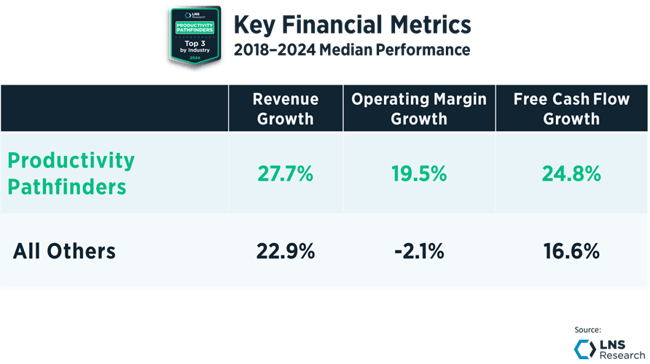
Figure 3 — Comparison of Productivity Pathfinders' Financial Performance vs. All Others
If you want to learn more about who these Pathfinders are and the four things they do differently from other companies, you can read the full 2024 report here. The 2025 companies will be announced at the Industrial Transformation Event, on October 28th - 30th in Chicago.