With today’s competitive global economy, it’s no surprise that manufacturing and industrial companies are constantly trying to cut costs and improve productivity. It’s often in the ability to deliver a product at a marginally lower cost, quicker time, higher quality, or a combination of factors that separates market leaders from the rest of the pack. However, after taking care of the so-called “low-hanging fruits,” identifying areas for improvement becomes increasingly difficult.
Operational excellence programs can help with this. They include plans for optimizing resources such as people, processes, and technologies in the context of operational and financial objectives. They also tend to encompass a set of metrics to provide visibility into the progress toward these objects. When it comes to finding improvements in cost and productivity, the overall equipment effectiveness (OEE) metric does a great job of shedding light into the effectiveness of key resources.
A strong OEE program, especially one that focuses on the quality aspect of the metric, can provide the tactical approach needed to realize measurable improvements in cost and productivity. Below, I’ll discuss this more in detail and also provide benchmark data from our recent quality management survey.
Overall Equipment Effectiveness with a Focus on Quality
OEE is one of the most holistic metrics an organization can use to measure an asset’s performance. At a high level, it has three variables: availability, efficiency, and quality. It’s common today for market leading organizations to invest in robust OEE visibility tools to provide more in-depth analytics on these three areas. We find that one of the most important pieces to realizing improvements in cost and productivity is in optimizing the quality variable of the OEE formula.
Attaining critical quality information often requires a set of tools such as Statistical Process Control (SPC) to provide real-time and visibility into the effectiveness and stability of processes. At a very granular level, SPC software delivers the capability for organizations to measure, analyze, and reduce variability in these business processes. Organizations implement SPC to support movement toward operational objectives, which in turn help to achieve financial objectives.
Operationally, SPC software’s visibility into variability and performance is important to those responsible for quality for two main reasons. First, quality managers at the site level can identify and address deviations in business processes earlier in the production process. And second, by scaling this granularity to the enterprise level, aggregating quality and performance data from hundreds or thousands of assets, the quality executive dashboard becomes much stronger.
Leveraging Real-time Quality Metrics to Improve OEE
Our 2012 quality management survey includes responses from nearly 400 manufacturing and industrial executives. One question regarded real-time visibility of quality metrics in manufacturing, which is depicted in the box plot below. The x-axis shows whether or not organizations currently have, are planning to have, or have no plans for real-time visibility of quality metrics in manufacturing. The y-axis shows the corresponding OEE performance.
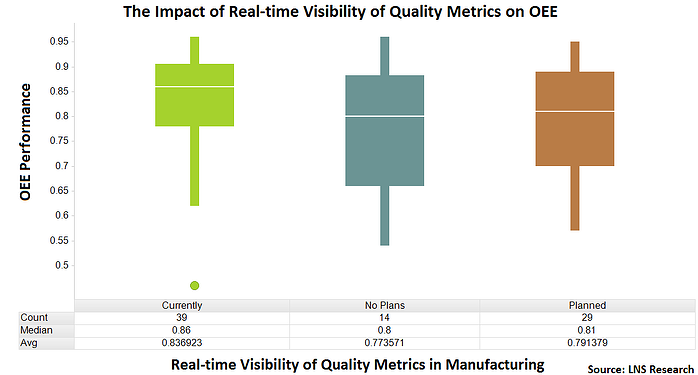
It's clear that people with real-time visibility of quality metrics in manufacturing are outperforming those without that capability. For the top two quartiles of companies that have real-time visibility of quality metrics, the variability in OEE ranges 86% to 95%. In contrast, the top two quartiles of companies with no plans for real-time visibility of quality metrics have an OEE performance that ranges from 81% to 94%.
Companies with real-time visibility of quality metrics in manufacturing outperform others by 6% in OEE Tweet this stat!
However, there's more to this story. We see considerable underperformance in the bottom two quartiles where companies have no real-time visibility of quality metrics in manufacturing. When it comes to cost and productivity in the competitive marketplace, the differentiator may just be the granular aspects of quality management. For companies performing at less than 80% in OEE, real-time visibility of quality metrics in manufacturing should be a prime area for investment.
You might also be interest in:
Overall Equipment Effectiveness: Benchmark Data by Industry
Cost of Quality Definition
Manufacturing Metrics: First Pass Yield Benchmark Data
