
Every quality leader hears the same complaint: escalations take too long. Root cause reviews often take weeks, and leaders debate the same risks in meeting after meeting, armed with better slides but no clearer answers.
So, then the blame game begins... Operations blames leadership. Leadership blames culture. Quality teams blame complexity. The conventional wisdom holds that slow quality decisions are a people problem, fixable with sharper accountability and a braver executive team.
That wisdom is incomplete. Leaders are the visible bottleneck, making them an easy target, yet most delays start much earlier, in the way quality data is created, fragmented, and interpreted across the enterprise.
Decision Velocity is the elapsed time between a quality signal and a committed, decision-grade action, measured separately for each organizational tier. A fast decision that gets reversed a week later does not count, so the measure pairs speed with the share of decisions that hold.
Embedded Quality leaders in our research outperform (Figure 1) their peers by:
-
29% in throughput
-
23% in net profit margin
-
20% in successful new product introduction (NPI)
-
17% in overall equipment effectiveness (OEE)
-
15% in first pass yield (FPY)
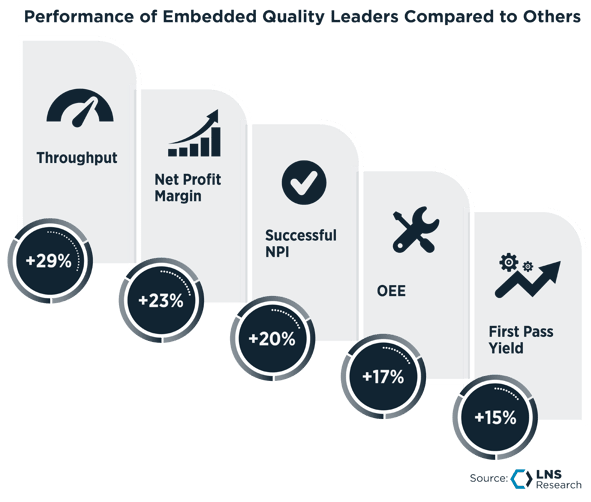
Figure 1: Performance of Embedded Quality leaders compared to others
The Reconciliation Tax Slows Every Decision
When manufacturing execution (MES), laboratory information (LIMS), product lifecycle management (PLM), and EQMS platforms each hold a partial version of the truth, decisions move at the speed of reconciliation. When FPY, OEE, and nonconformance report (NCR) metrics differ across sources, debate replaces action. When root cause analysis depends on stitching together spreadsheets, emails, and tribal knowledge, learning stalls.
Consider how this looks from four chairs. A line operator sees a torque reading drifting and waits for someone to confirm it. A supplier quality engineer holds a nonconformance that the plant system has never heard of. A plant manager receives two yield figures for the same shift. A Chief Quality Officer (CQO) opens a monthly review and spends the first twenty minutes deciding which number is right.
Traditional quality decision-making follows one path: Event → Discovery → Data Collection → Evaluation → Event Decision → Product Decision (Figure 2). Production continues at every arrow, and additional defects accumulate with it.
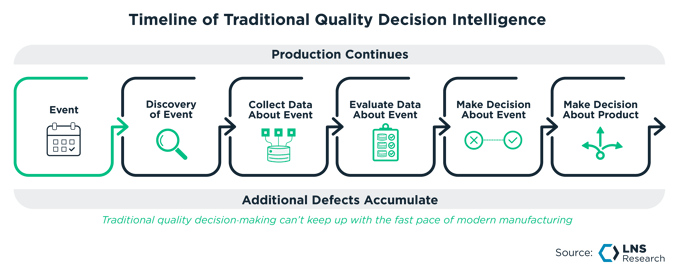
Figure 2: Timeline of traditional quality decision intelligence
We call the time lost at the reconciliation step the "Reconciliation Tax." Every quality organization pays it, and almost none measure it. Leaders with plenty of courage and competence still slow down when the organization asks them to decide in the fog.
The Leaders who pull ahead design a Quality Data Architecture that makes the right decision obvious at the moment it matters (Figure 3). That ambition runs far beyond traditional quality event management.
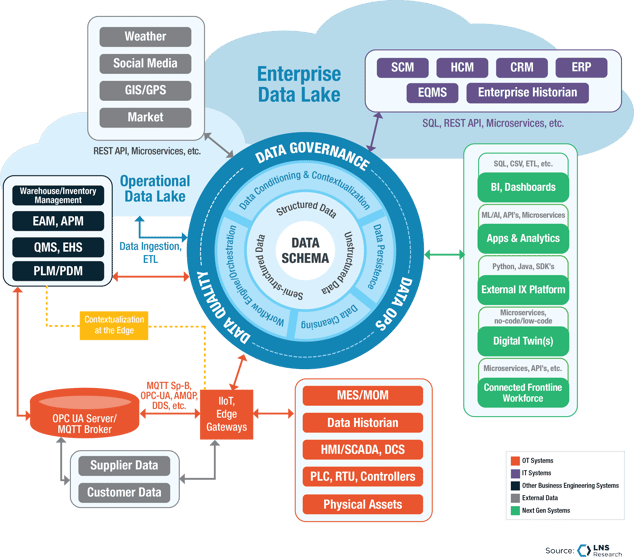
Figure 3: Quality data architecture spanning enterprise, operational, and edge sources
The Rising Cost of Slow Decisions
The recall data points to what’s at stake when quality decisions move slowly. According to the Sedgwick Brand Protection 2025 Recall Index Report, the total count of recalls has risen since 2019, and units on recall have nearly tripled over the same period (Figure 4). Slow, traditional decision-making is losing ground to the pace of modern manufacturing.
In LNS Research's Embedded Quality research, CQOs prioritize compliance investments over brand reputation protection by a margin of four to one. Meanwhile, Cost of Poor Quality (COPQ) lags reality by weeks or months, so it shows the cost only after the damage is already done.
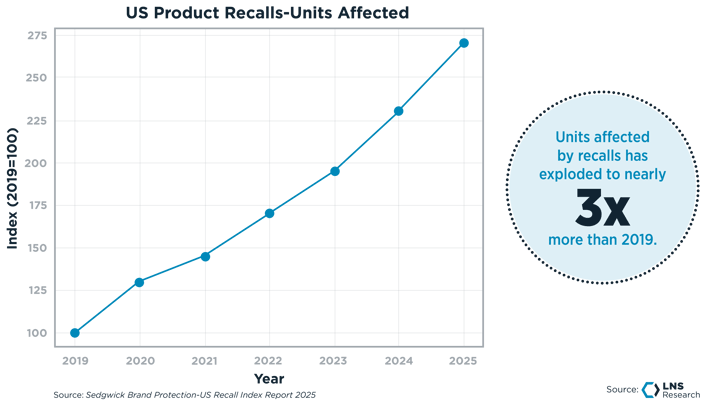
Figure 4: US product recalls, units affected
Most organizations overlook a critical mismatch, and decision timeframes vary dramatically across the enterprise:
-
-
-
Frontline operators need answers in seconds or minutes.
-
Supervisors and plant leaders need clarity in hours.
-
Executives and boards operate on weekly, monthly, or quarterly cycles.
-
-
In quality systems, monthly reports dominate. Dashboards report yesterday’s news, and blame becomes the go-to tactic. Postmortems earn their place as the source of lasting learning, and they become a problem when they serve as the main control, because every lesson then arrives after the cost. What happens when the data shows up after the decision window has closed? The decision gets made anyway, on judgment alone.
Slow Decisions Erode Trust Along with Performance
The hidden damage reaches beyond the P&L. Slow decisions quietly erode organizational trust. A 2019 Forbes analysis charted speed against trust and shows speed climbing at every step up the trust scale, from 22 in the lowest band to 79 in the highest (Figure 5).
We see the same relationship across our research on Organizational Change Management and The State of IX Tech, and COOs in LNS Research's The COO Council™ describe trust, speed, and culture as inseparable. In daily operations, the erosion looks like this:
-
-
-
Operators stop escalating issues because “nothing happens anyway.”
-
Engineers rely on judgment calls because data arrives too late to help.
-
Leaders grow skeptical of quality metrics that cannot guide real trade-offs.
-
Quality decisions wait on endless consensus meetings while production absorbs the cost of the delay.
-
-
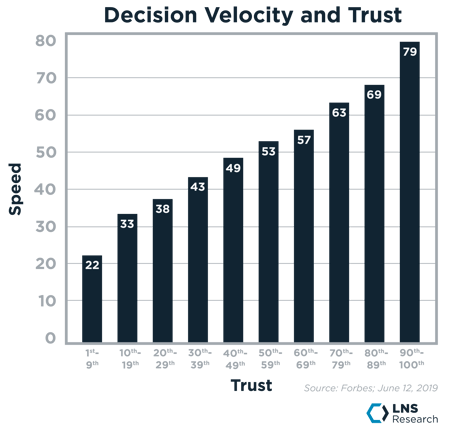
Figure 5: Decision velocity and trust
Customers feel this friction long before executives see it. Delayed containment becomes field failures. Inconsistent decisions become uneven customer experiences. Each slow decision raises the odds of an escape that damages reputation, loyalty, and confidence.
This is why Delivered Quality Leaders think differently. Delivered Quality (Figure 6) is the quality the customer experiences in the field, and it is the North Star for everything in this article. Trust builds when decisions are made quickly, consistently, and explainably. Speed signals competence. Clarity signals alignment. Hesitation signals risk.
Decision Velocity Gives Quality a Metric Customers Can Feel
Decision Velocity reframes quality performance around a single ambition: making the right decision quickly at each level of the organization. Safety, compliance, and rigor all gain from it. The metric tracks how fast quality data becomes decision-grade insight across time horizons, from seconds on the line to months in the boardroom. It aligns directly with Delivered Quality because customers experience the outcome of decisions and never see the elegance of the analysis behind them.
Three measures make it operational for each tier:
-
-
-
Time to decision: elapsed time from quality signal to committed action.
-
Decision hold rate: the share of decisions that stand without reversal or reopening.
-
Reconciliation time: hours spent settling which data is right before the decision can be made.
-
-
In our latest research on Industrial AI, Leaders are twice as likely to align data with the decision flow. Quality Data Architecture is a decision strategy, and it deserves a business owner.
Embedded Quality Makes Decision Velocity Real
Embedded Quality builds quality into design, manufacturing, and delivery through effective strategy, collaboration, closed-loop automated processes, and a product-to-customer focus (Figure 6). It supplies the practical path to Decision Velocity through five capabilities:
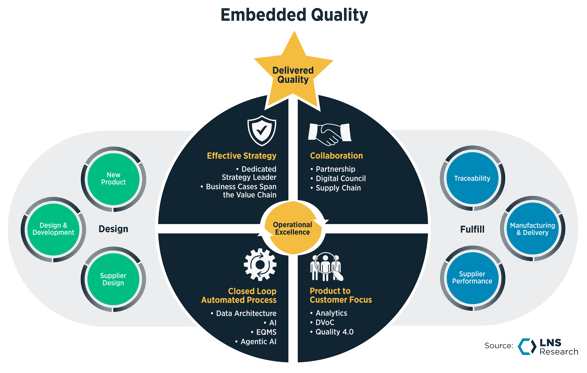
Figure 6: The Embedded Quality framework
-
-
-
Data orchestration layer. It spans the value chain, ingesting design intent, supplier capabilities, manufacturing assets, process checkpoints, and, finally, the customer perspective.
-
Predictive Quality Model. AI and machine learning build and operate it to guard the factory door.
-
Digital Voice of the Customer (DVoC). These tools surface customer trends and sentiment and carry them back up the value chain into better designs and targeted improvement actions.
-
EQMS as a process engine. When signals cross thresholds, actions trigger automatically, learning loops close faster, and root causes surface sooner. This is the core enabler of "Costless Compliance," in which compliance records are captured as a byproduct of the work at the moment of action.
-
Connected Frontline Workforce (CFW) applications. They deliver insights to the people doing the work and capture the actions taken, which closes the last mile to where quality actually lives: the manufacturing shop floor.
-
-
Together, these connect design intent, supplier performance, manufacturing signals, and customer feedback into a shared context, built on a Quality Data Architecture that eliminates metric debates and replaces them with shared understanding (Figure 7).
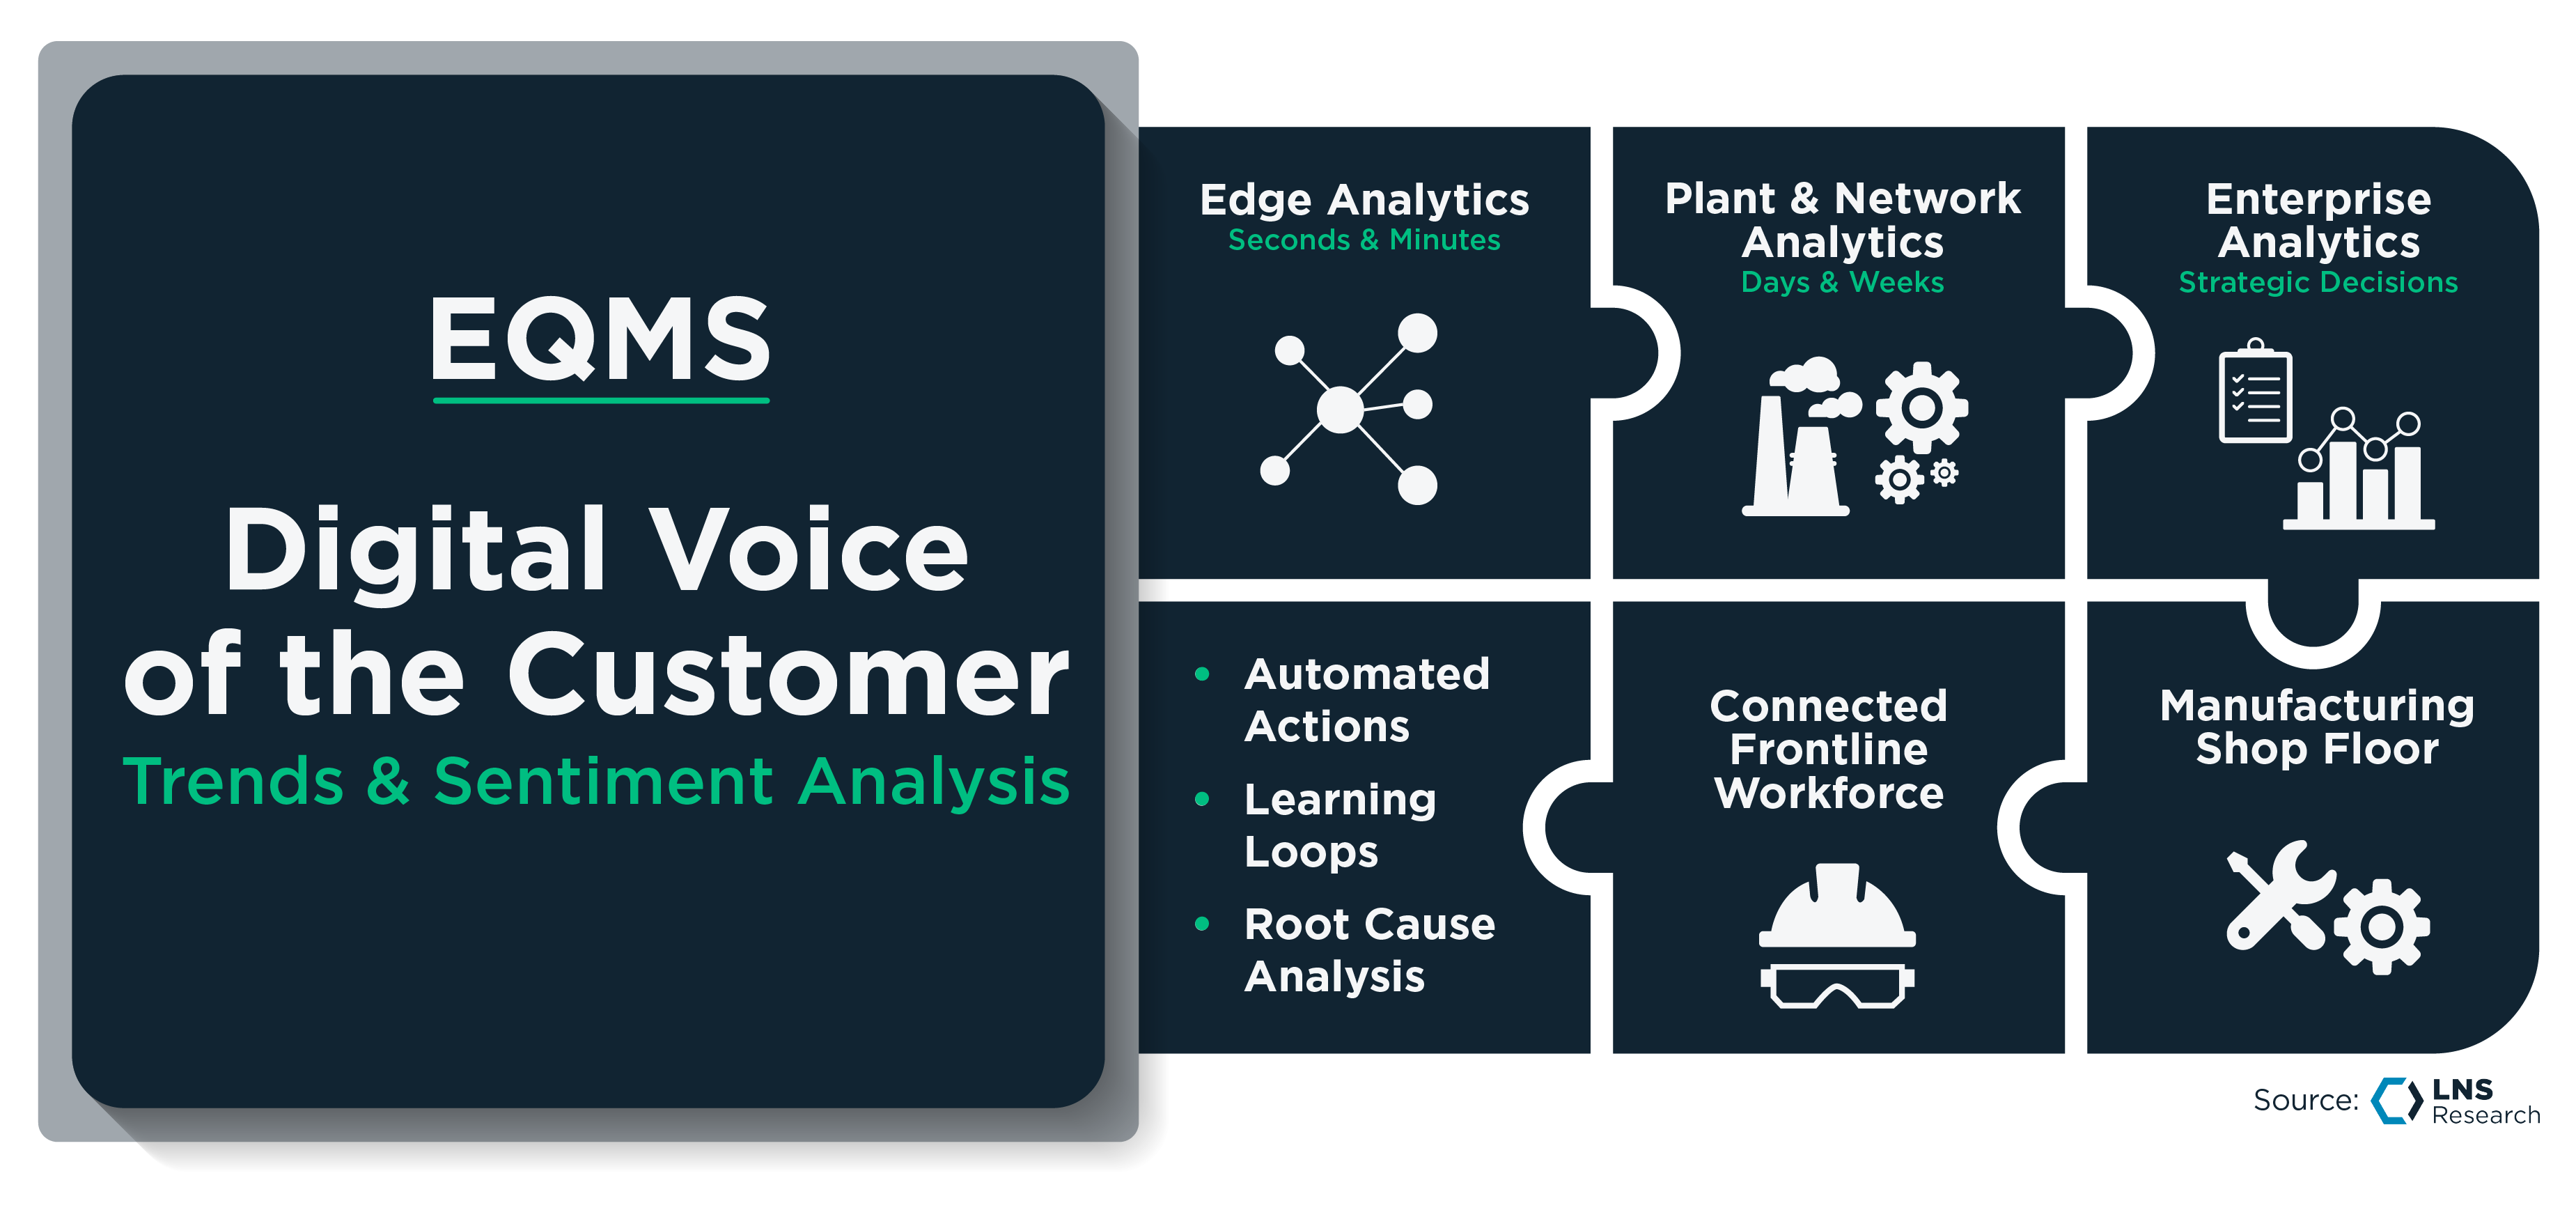
Figure 7: Quality Data Architecture
Data-based decision-making becomes the norm because data arrives in time to matter. Trust grows as decisions become consistent. Friction falls, and Decision Velocity rises with it.
Faster Decisions Beat Better Presentations
Quality has spent decades perfecting the art of explaining yesterday’s failures. The ground has shifted. In a world of rising complexity, volatile supply chains, and unforgiving customers, Decision Velocity is the new Quality KPI. It captures what traditional metrics miss: the organization’s ability to see clearly, decide quickly, and act consistently before defects become disasters.
Chief Quality Officers looking to accelerate a data-based, customer-centric quality culture should take four actions:
1. Put a clock on every quality decision.
Name the decision, the tier that owns it, and the elapsed time from signal to commitment you will accept. Operators need seconds, plants need hours, executives need weeks of accumulated evidence. Redesign your Quality Data Architecture around those clocks, because decisions nobody times drift toward the slowest tier, where most quality systems already sit.
2. Assume each of your systems knows a different version of the company.
When MES, LIMS, PLM, and EQMS tell different stories, leaders hesitate. Settle one definition each for FPY, OEE, and NCR before the next review, and track the hours your teams spend reconciling data. That is your Reconciliation Tax, and it is a line item you can present to the CFO.
3. Close the loop while the signal still matters.
Root cause analysis that takes weeks signals a learning loop running slower than the business. Let EQMS trigger actions when signals cross thresholds and capture the response through CFW applications. Fast learning is worth its weight in gold.
4. Judge your quality culture by whether good decisions repeat at the same speed next quarter.
People adopt quality processes that remove uncertainty and speed action, and trust follows consistency. Track the decision hold rate alongside time to decision, and Decision Velocity becomes the most practical lever you have for building organizational trust.

All entries in this Industrial Transformation blog represent the opinions of the authors based on their industry experience and their view of the information collected using the methods described in our Research Integrity. All product and company names are trademarks™ or registered® trademarks of their respective holders. Use of them does not imply any affiliation with or endorsement by them.