Once-in-a-generation tariffs, supply disruptions, and AI investments all led to much uncertainty; would manufacturers be able to navigate the storm and return to growth?
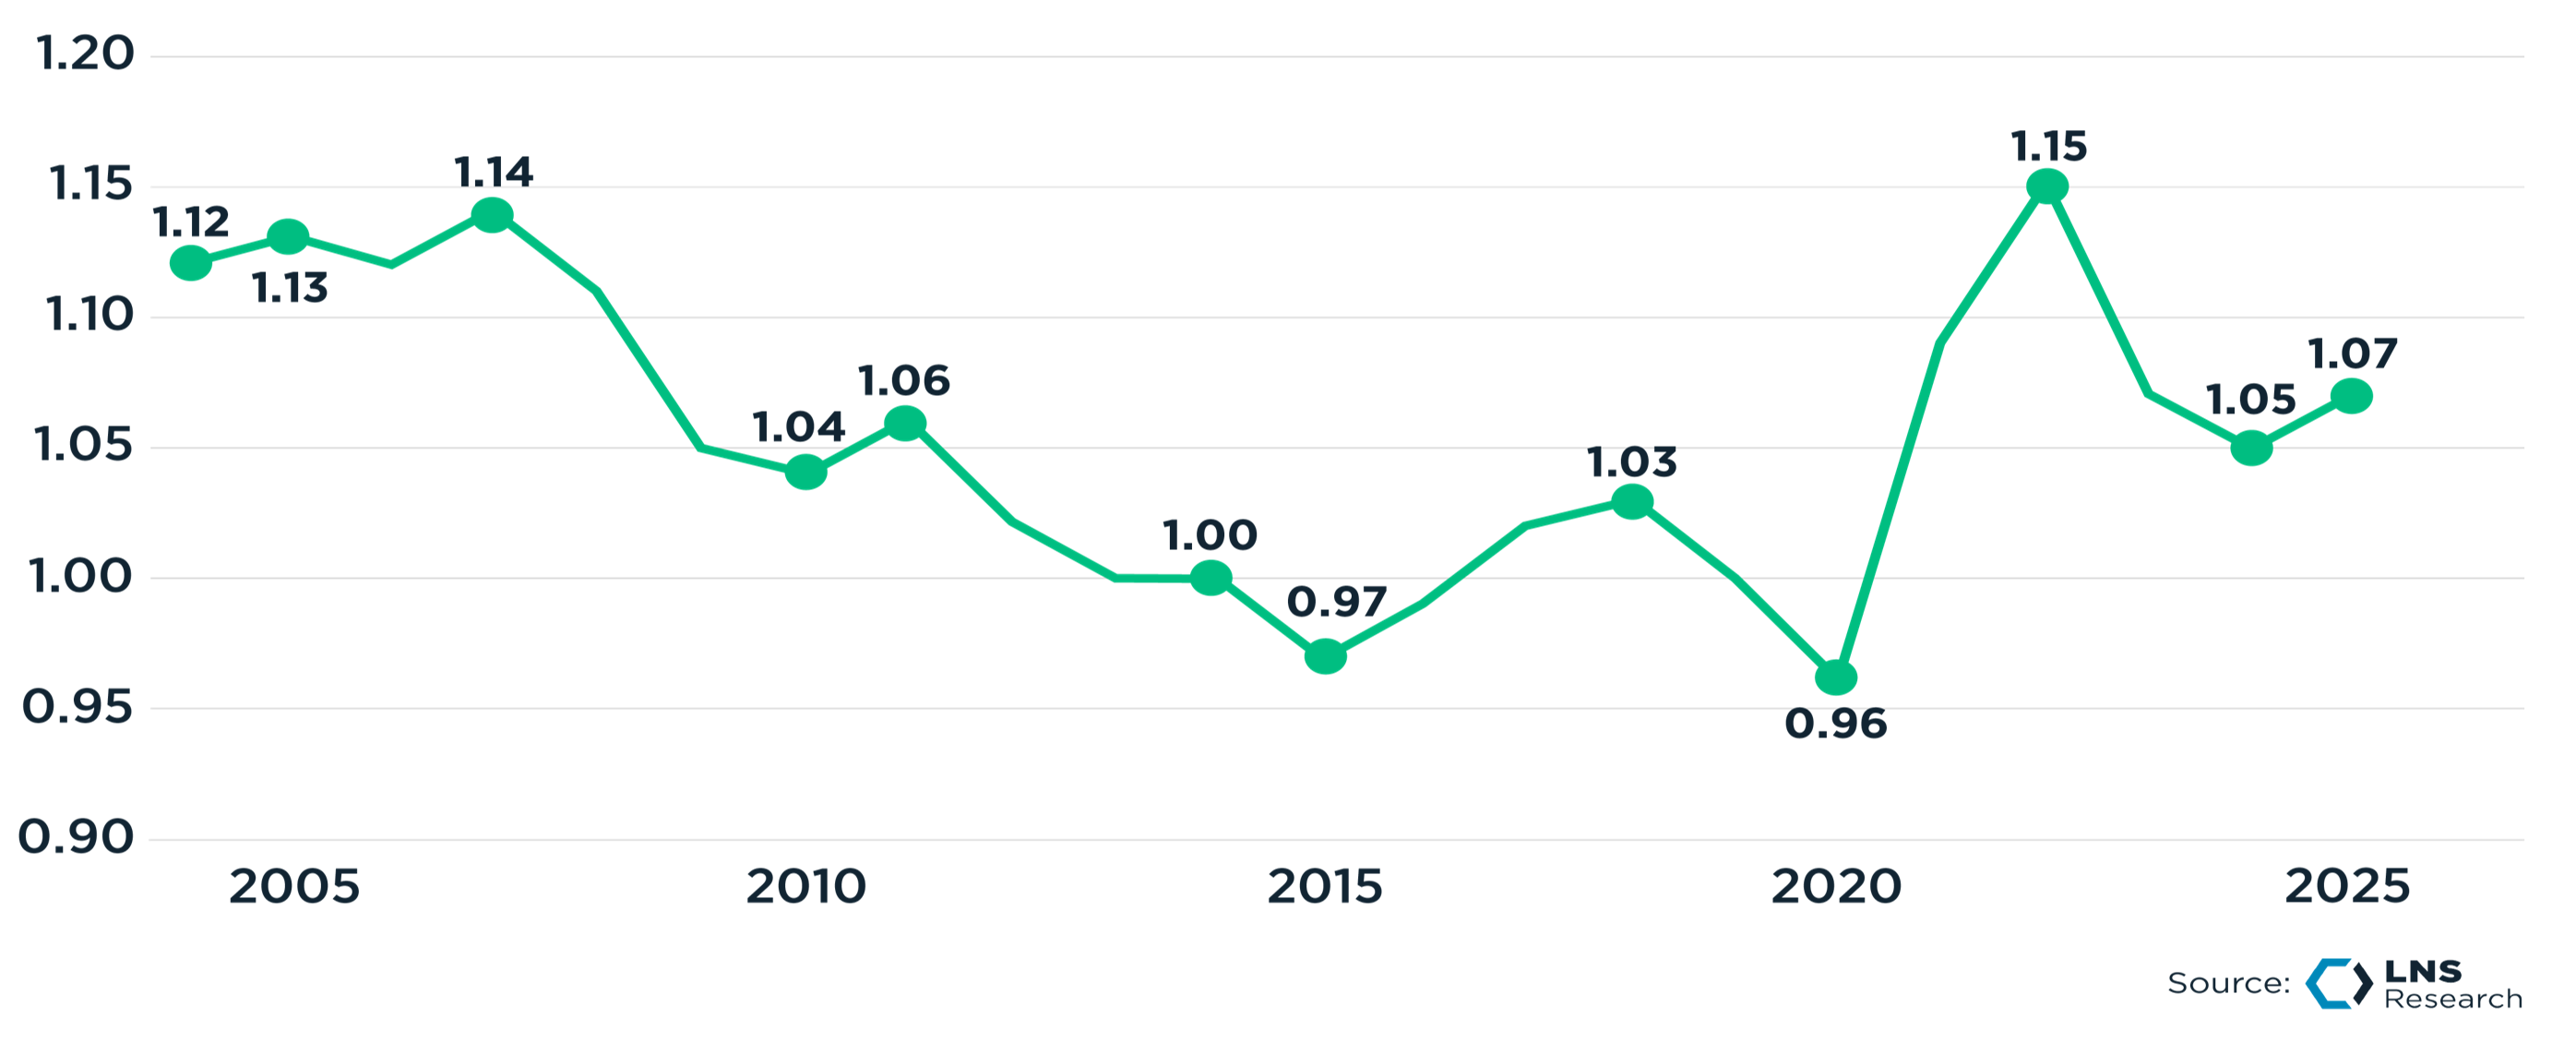
The Industrial Productivity Index trended downward for 13 years, from its 2007 pre-global financial crisis peak to the 2020 COVID-induced recession low, dropping by over 15% over the period.
No industry rebounded harder than the industrial sector coming out of the lockdowns, reaching a new all-time high in 2022. Unfortunately, in the following two years, we gave back almost half those gains. Luckily, the tough decisions manufacturers began making starting mid-2023, coupled with the prudent investments in people, process, and technology change, have paid off.
The 2025 data offer a more constructive reading: aggregate industrial productivity improved, but it is also a cautionary tale. The separation between the strongest performers and the rest of the market continues to widen. Highlighting how productivity decline can become a negative feedback loop for many companies, while also driving accumulated advantage for those that are enjoying sustained growth.
2025: Industrial Productivity Index Returned to Growth
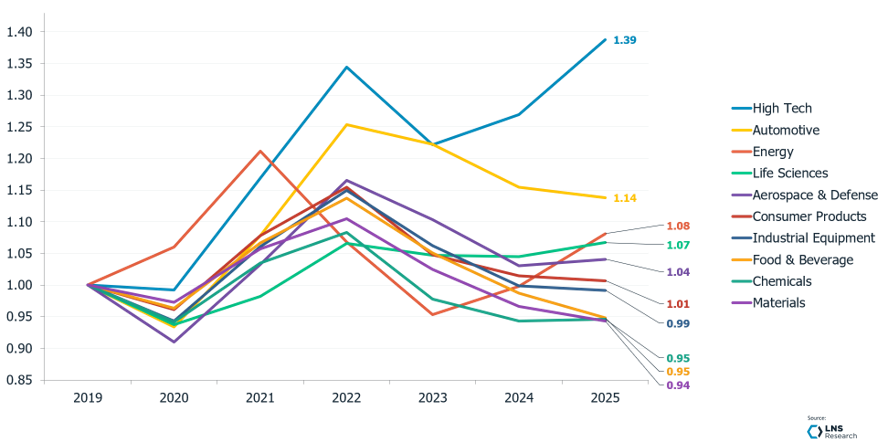
Disaggregated by industry, the dispersion is substantial. High Tech is the clearest outlier, up roughly 39 percent since 2019 and still rising in 2025, supported by the capital cycle in semiconductors, AI infrastructure, and advanced electronics. Automotive is next, led by the heavy-duty and commercial vehicle makers, and Energy has recovered to about 8 percent above its 2019 level on the strength of the integrated and midstream operators. Life Sciences and Aerospace and Defense sit modestly above their 2019 baselines.
Industrial Productivity by Industry
The remaining groups have not fully recovered. Consumer Products is approximately flat to 2019, while Industrial Equipment, Food and Beverage, Chemicals, and Materials remain below it, reflecting in part the input-cost pressures that weighed most heavily on materials- and energy-intensive businesses. The broader pattern is consistent across the dataset: industry conditions explain only part of the outcome, and within every group, including those still below baseline, some companies have continued to gain ground.
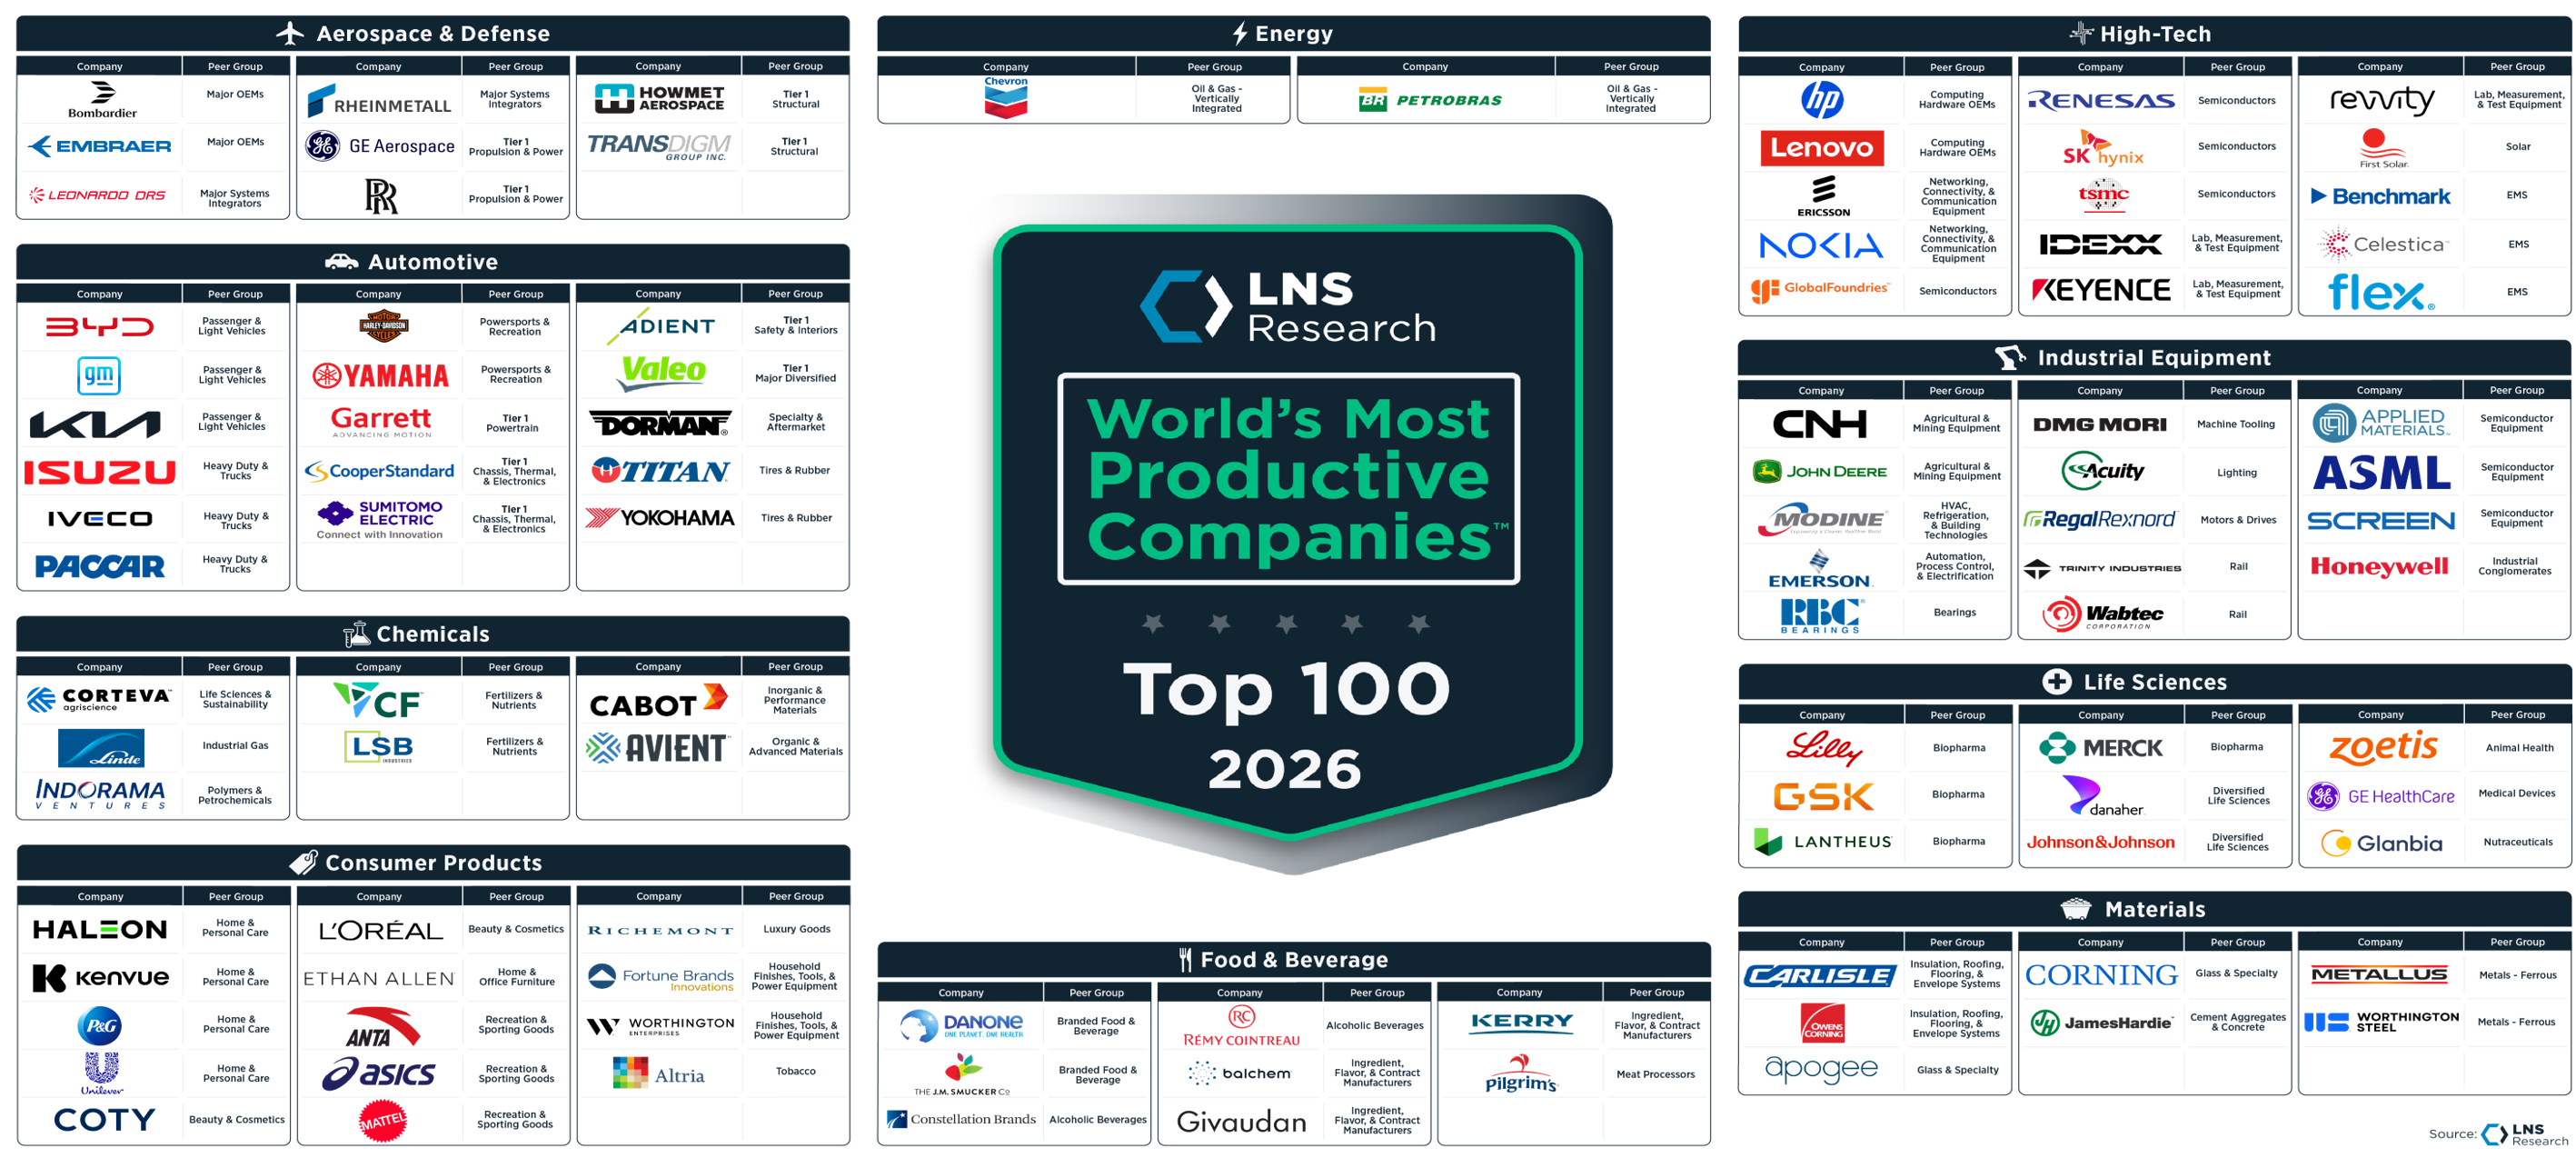
The 2026 World's Most Productive Companies
Identifying those companies is what the research is designed to do. We estimate Total Factor Productivity across the end-to-end value chain for more than 600 publicly traded industrials, spanning 10 industries and over 100 product categories, indexed to 2019. Two groups stand out within that population:
Productivity Pathfinders are the top 30 companies by differentiated industrial productivity growth since 2019, fewer than 5 percent of the field.
The World's Most Productive Companies are the top 100, ~15 percent of the field. We refer to these as Market-Shaping Enterprises, companies that have meaningfully reset performance expectations in their industries.
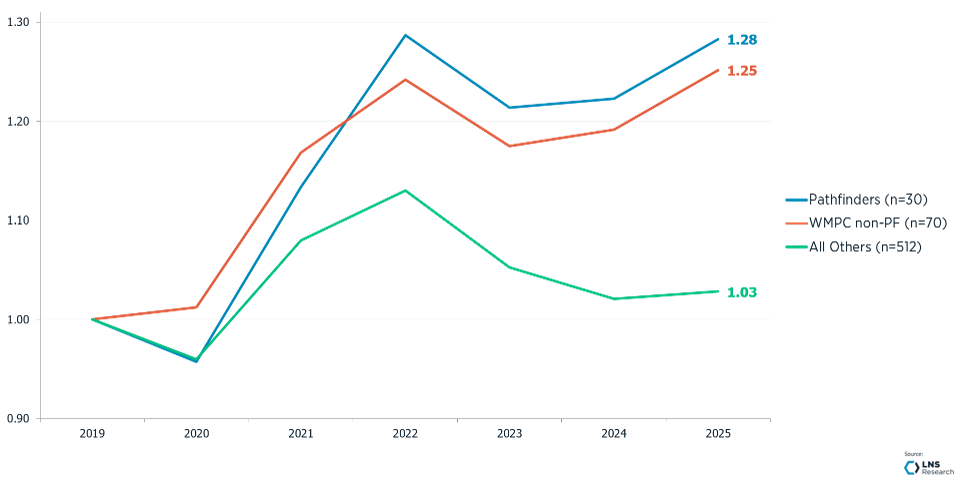
The productivity gains since 2019 have been concentrated. On a revenue-weighted basis, the Pathfinders are up more than 28 percent, and the remaining World's Most Productive Companies are up about 25 percent, while the other 512 companies are up only about 3 percent over six years. Much of that smaller gain reflects the 2021 to 2022 cyclical recovery, which has since faded.
The Gains Remain Concentrated
The distribution matters as much as the average. Rather than a broad improvement across the field, the data shows a relatively small group extending its lead, with the gap widening in each year since 2019. That persistence is the part most worth attention: the separation has not been a single-year event.
Productivity Growth of the World's Most Productive Companies and Productivity Pathfinders
What the data describes is two dynamics running in opposite directions, and both tend to reinforce themselves.
For companies that have fallen behind, the risk is a negative feedback loop. Weaker productivity compresses margin and cash, which leaves less to reinvest in the capability, technology, and talent that would restore it. Capability erodes a little further, productivity slips again, and the next year starts from a lower base. None of the individual steps looks dramatic, which is part of why the loop is hard to break: each one resembles ordinary cost management under pressure.
For companies that have sustained growth, the same mechanism works in reverse, as an accumulated advantage. Productivity gains generate the margin and cash that fund the next round of investment, which raises capability and produces the next gain. The lead is not simply larger each year; it is increasingly self-funding. That is why the strongest performers are difficult to catch from behind. They are not running the same race a few steps ahead, they are reinvesting their advantage faster than the field can close it.
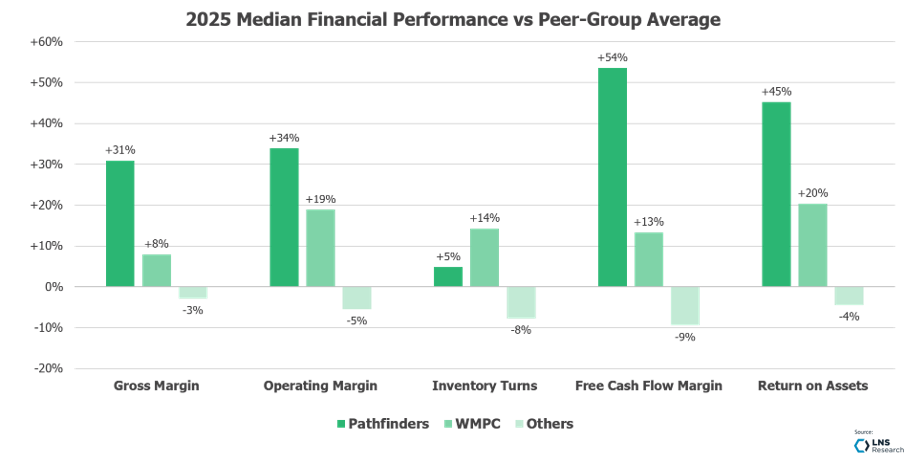
Productivity and Financial Performance
Higher productivity is associated with stronger financial performance, and the relationship is most visible in the measures boards tend to watch. On a relative basis, the Pathfinders operate at operating margins on the order of 30 to 35 percent above the broad-industrial baseline, with the remaining World's Most Productive Companies in between and the rest of the field slightly below it.
The free cash flow gap is wider, which suggests capital discipline as well as profitability: the most productive companies generally are not funding growth at the expense of the balance sheet. Returns on assets follow a similar pattern.
Inventory turns are a useful qualification to the story. Here, the broader group of World's Most Productive Companies tends to turn inventory faster than the Pathfinders, which is better read as a difference in strategy than as a weakness.
The Pathfinders are generally not competing to maximize turns on a commodity catalog. They tend to carry the inventory that a differentiated, higher-value product mix requires and to size it to that demand. Their advantage shows up in margin, cash generation, and returns rather than in turns, which is consistent with a more differentiated competitive position.
What Drives Productivity Decline, and What Protects Against It
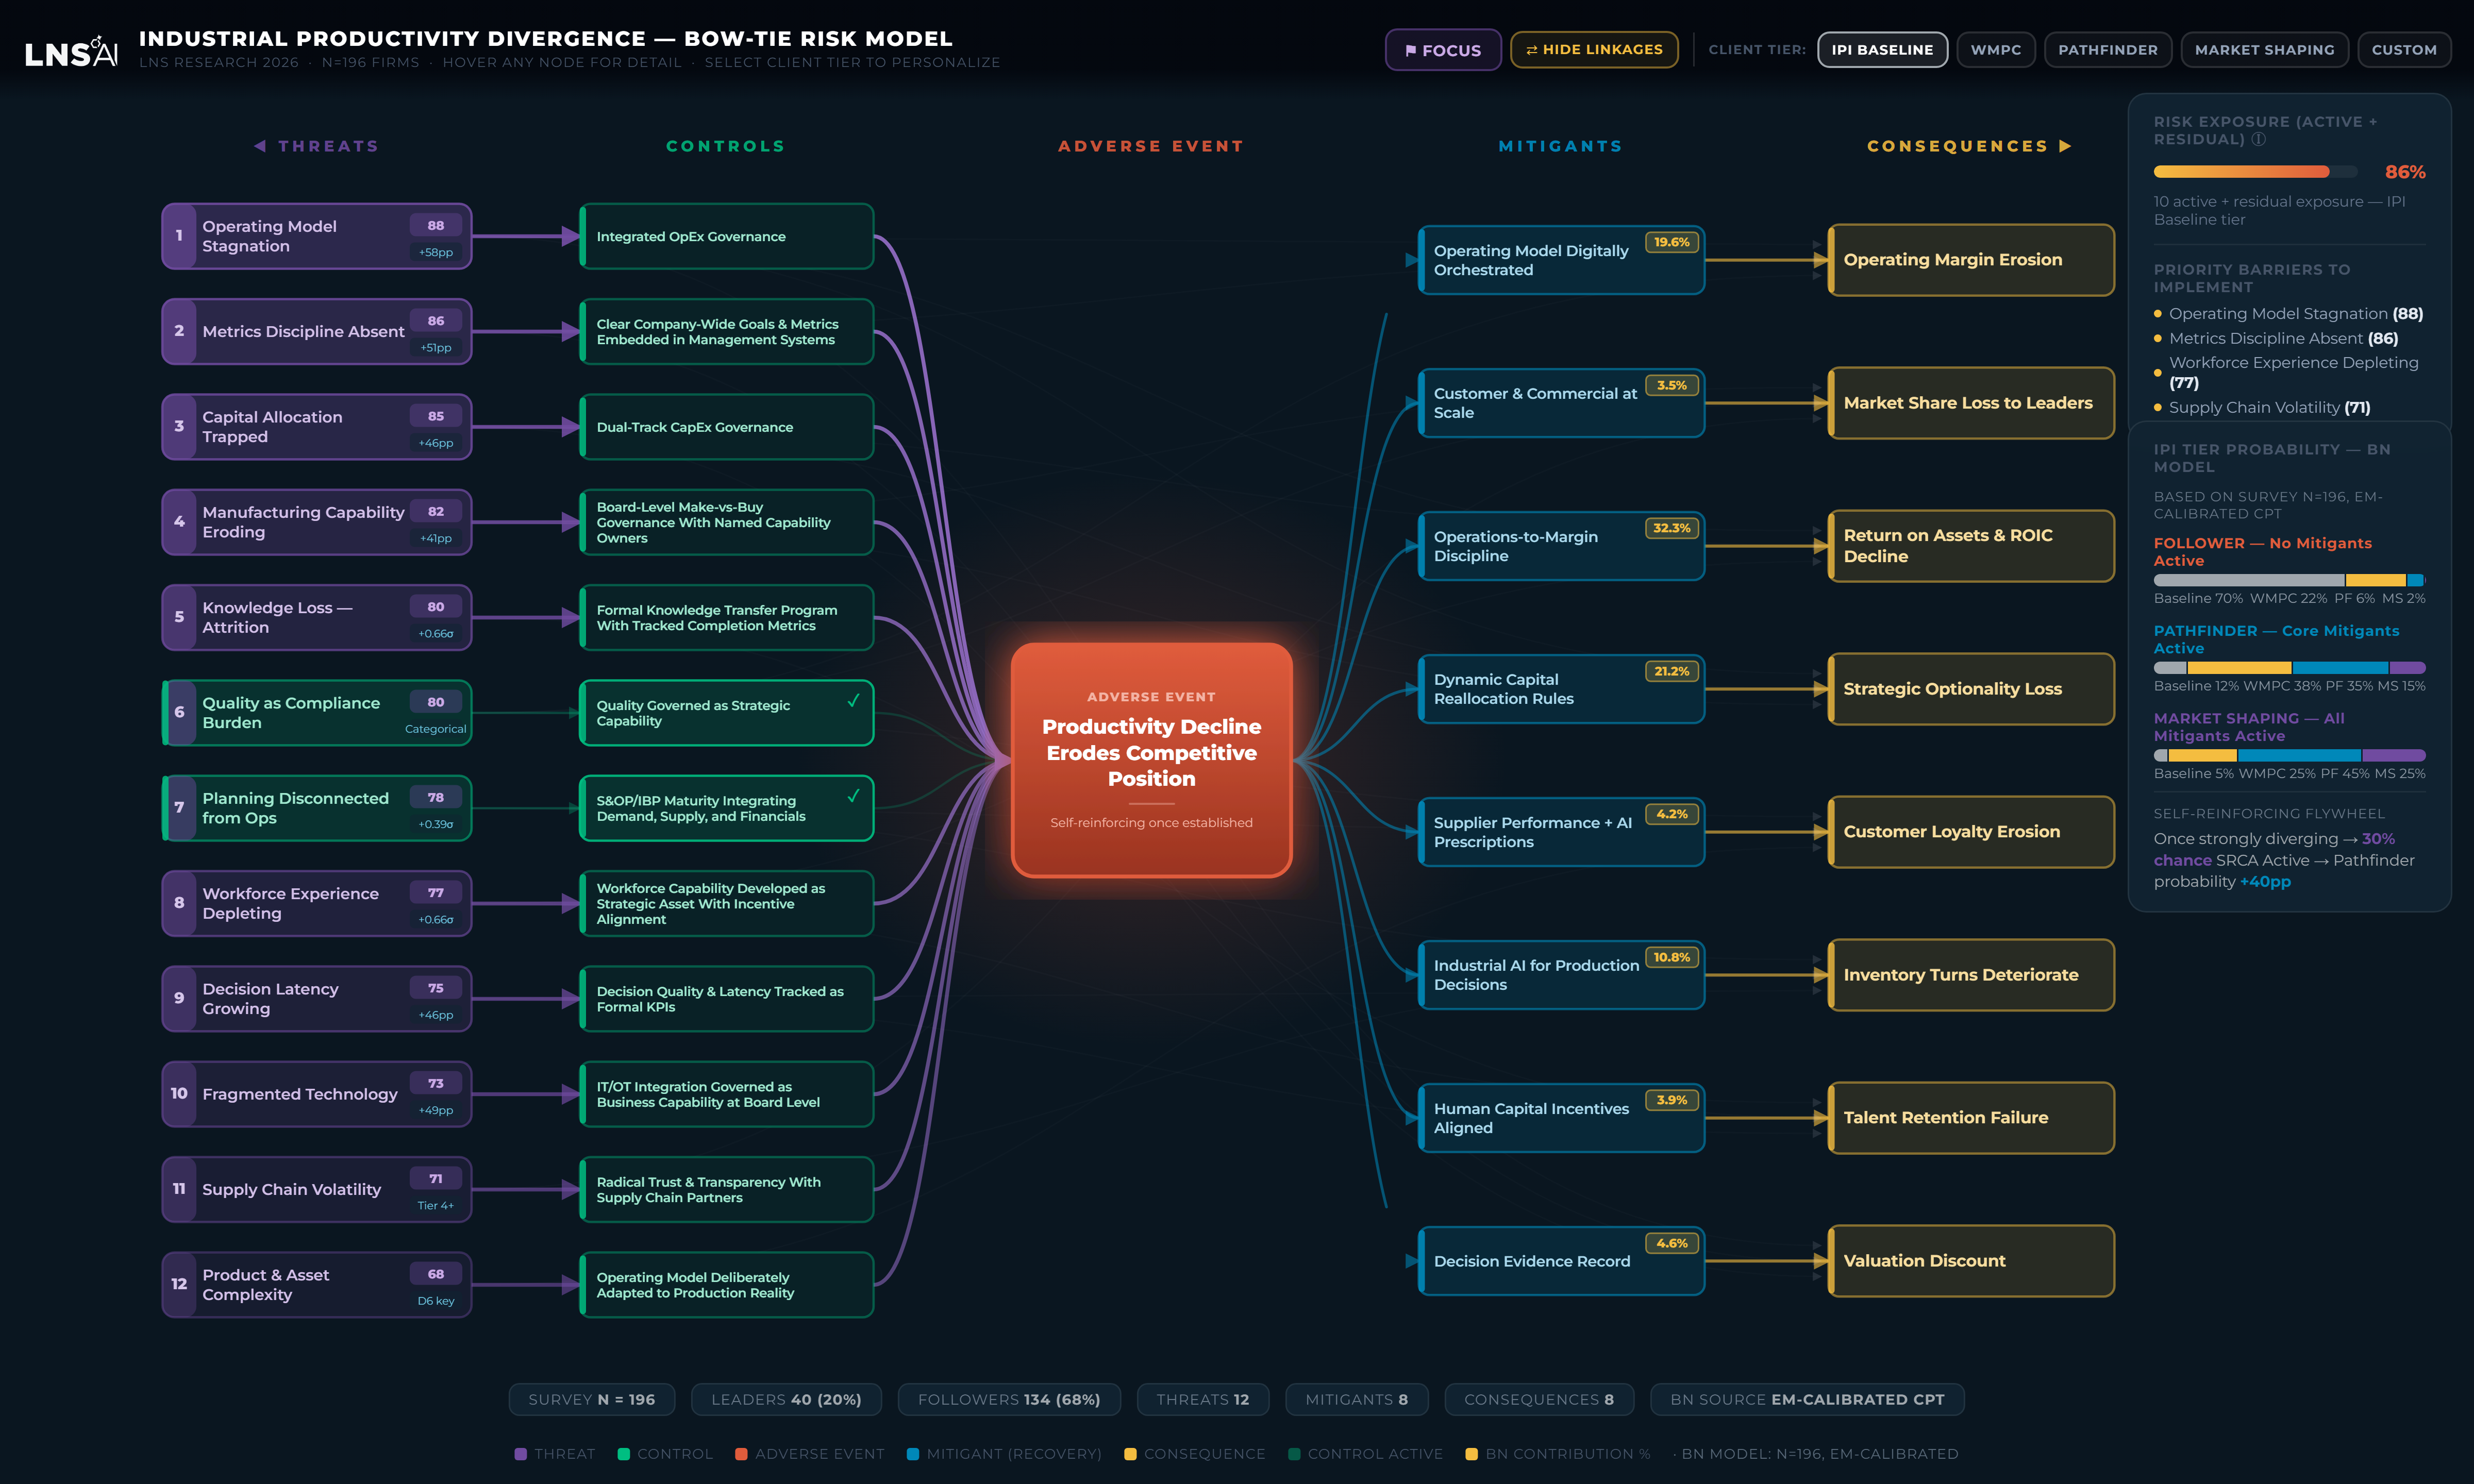
Identifying the leaders does not by itself explain why other companies fall behind, or what can be done about it. To examine that, we moved beyond correlation. Using Bayesian networks, maximum spanning trees, variable clustering, and other ML techniques, across the analysis of nearly 200 industrial companies, we built an LNS AI Risk-Centric Causal Network application as Critical Decision Infrastructure for the outcome most operating leaders are trying to avoid: a productivity decline that erodes competitive position.
The model treats this as a common rather than an exceptional outcome, and it maps both how companies tend to arrive at it and how they avoid it.
The model is organized as a bow-tie. On the left are the threats that move a company toward decline and the controls that prevent them. On the right are the mitigants that limit the damage and the business outcomes that are ultimately affected.
The Top 5 Threats
The threats are the internal conditions that set a productivity decline in motion, most of them rooted in how the business is run and governed rather than in the market.
The most influential is operating model stagnation, where a modern, complex, and distributed business is run on an operating model designed for a slower and more vertically integrated era.
A related threat is the absence of metrics discipline, where goals are set at the top but are not embedded in how decisions are made day to day.
Capital allocation can become trapped behind ROI gates, where each request must show a quantified return, so capability and optionality investments without a clean payback are deferred.
Manufacturing capability can erode through a sequence of individually reasonable outsourcing decisions until a company no longer owns the value it sells, a pattern broadly consistent with recent government productivity data.
Institutional knowledge can be lost as experienced staff retire faster than their expertise is captured. And quality is sometimes managed as procedural compliance rather than as the delivered quality a customer experiences, with rework absorbing capacity.
A common feature of these threats is that they develop gradually. Individually, they often resemble reasonable cost management, and they tend to become visible in the financials only after they are well established.
The Controls
Each threat has a corresponding control. Operating model stagnation is addressed by integrated operational excellence governance that keeps the operating model current rather than revisiting it only in a crisis. Weak metrics discipline is addressed by embedding clear, company-wide goals in the management system. Trapped capital is addressed by dual-track capital governance that funds a strategic optionality track without requiring a direct return on every item. Eroding capability is addressed by treating make-versus-buy as a board-level decision with named owners for each core capability. Knowledge loss is addressed by a formal knowledge transfer program with tracked completion. Each of these is a governance mechanism rather than an aspiration, and can be assigned, implemented, and measured.
The Mitigants
If a threat does materialize, the model points to the actions that do the most to keep it from becoming a competitive loss. The most influential is operations-to-margin discipline, which connects operational decisions to margin and return on assets so that the business optimizes for value rather than activity.
Others include dynamic capital reallocation that moves capital on pre-defined triggers, a digitally orchestrated operating model run on current data rather than month-end reporting, and industrial AI applied to production decisions rather than confined to dashboards.
A further set, including scaling commercial operations, maintaining a decision evidence record, integrating supplier performance, and aligning human capital incentives, contributes as well. A reasonable read of the model is that a relatively small number of these actions account for most of the protective effect, which argues for concentration rather than a long list of initiatives.
The Outcomes
The outcomes are what a productivity decline looks like once it has taken hold. When the controls are not in place, the threats are far more likely to trigger that decline, and the effects surface in the numbers: margin erosion, market share lost to better-performing competitors, declining returns on assets, weaker customer loyalty, deteriorating inventory turns, higher attrition, and, over time, a valuation discount as the productivity story becomes harder to demonstrate to investors.
By the time these appear, the company is forced to spend its resources on reactive mitigation, recovering ground it has already lost, rather than on the proactive controls that would have kept the decline from starting. The further downstream you are when you address a problem, the more expensive it is to fix.
How the Picture Changes from Baseline to Market-Shaping Enterprise
The model is perhaps most useful read as a progression, because the active risks and mitigants are not the same at every level of performance.
Baseline. Most industrial companies govern the basics, typically quality and planning, but few of the other controls are formalized. Exposure to decline is comparatively high and largely unmanaged, and decline tends to be handled reactively rather than anticipated.
World's Most Productive Companies. At this level, the core internal governance is generally in place: the operating model is treated as a living system, company-wide metrics are embedded in decisions, the workforce is developed as a strategic asset, and supply relationships move toward greater transparency. The largest internal gaps are closed, and the risk is managed more deliberately.
Productivity Pathfinders. The leading group additionally tends to have the harder controls in place: capital governance that funds optionality without an ROI gate, board-level make-versus-buy with named capability owners, formal knowledge transfer, decision latency tracked as a metric, and IT and operations working from a shared roadmap. With the core mitigants also active, the modeled risk of entering the decline loop becomes small, and the company is more likely to extend its advantage than to defend it.
Market-Shaping Enterprise. At the top of the distribution, the remaining control tends to be present: the operating model is deliberately adapted to the company's actual product and asset complexity. With effectively all of the mitigants active, the dynamics tend to become self-reinforcing, as the existing advantage funds the next round of capability. Companies at this level are generally not only lower-risk; they are in a position to influence the standards and expectations their competitors respond to.
The practical implication is that the path is reasonably legible and sequential. A company is unlikely to move from baseline to Market-Shaping in a single step. The more realistic progression is to govern the basics, close the internal gaps that characterize the top 100, and then take on the harder capital and capability controls associated with the Pathfinders, after which the self-reinforcing dynamics do progressively more of the work.
Notably, the model accounts for factors outside a company's direct control, including the business cycle, capital-market short-termism, and the pace of AI adoption, and still finds that internal systems explain much of the separation between the leaders and the field.
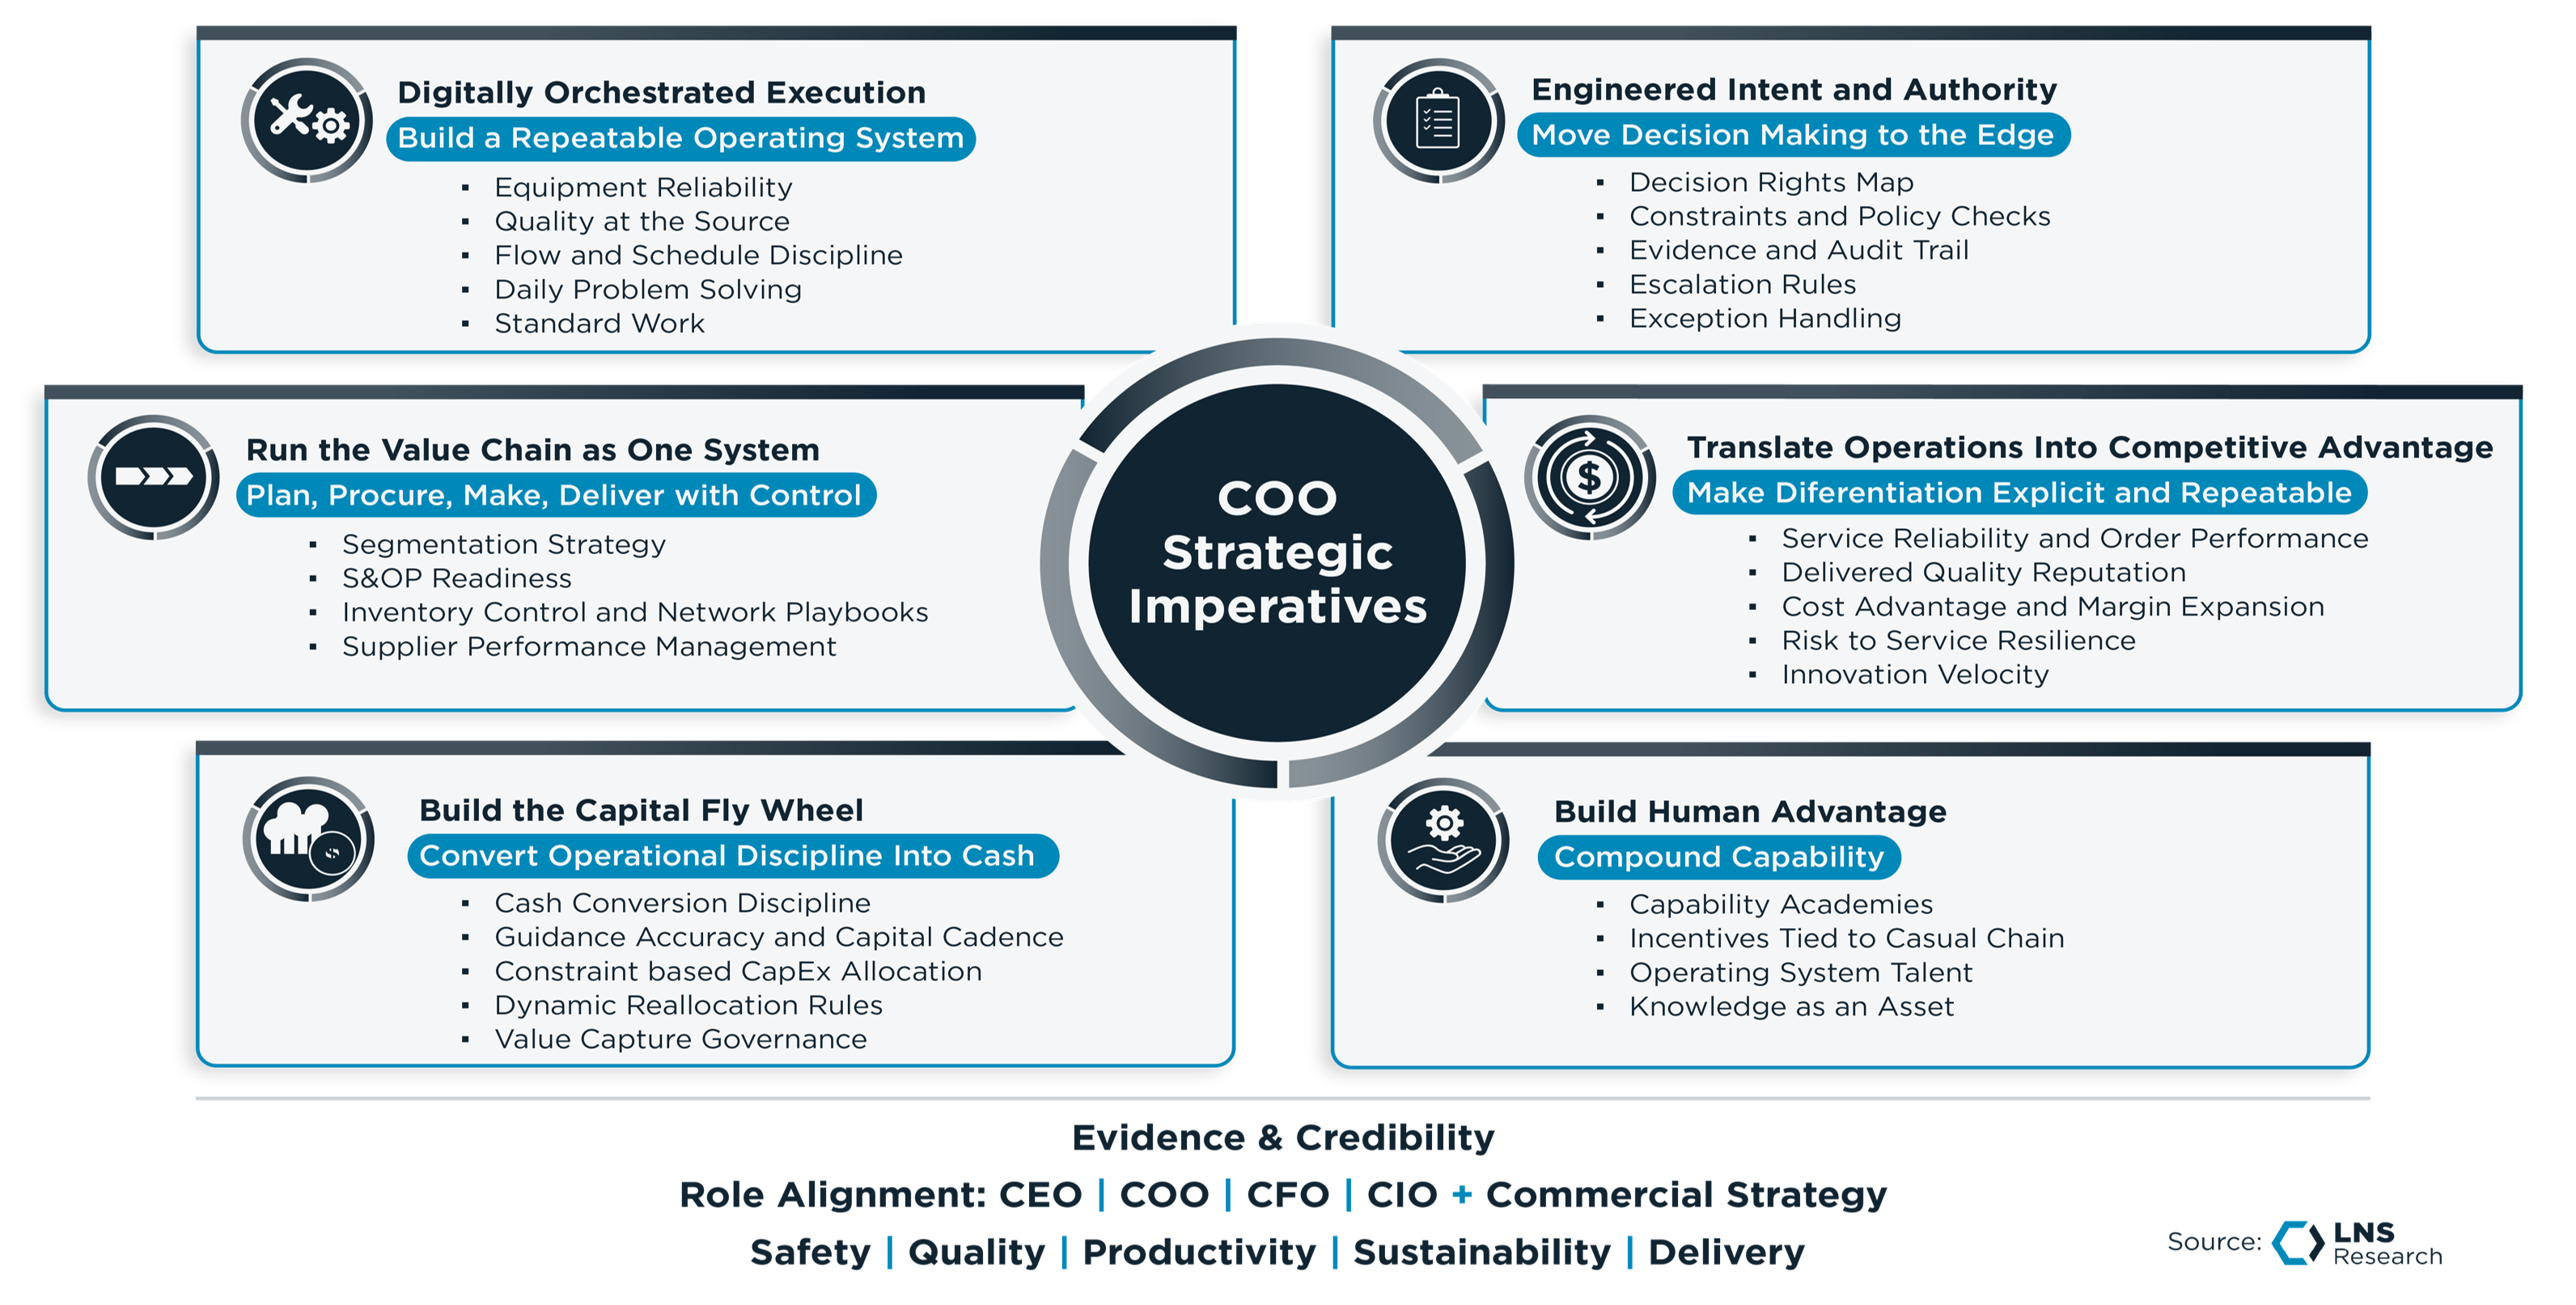
From Risk Model to Operating Strategy
Read this way, the model functions as an operating agenda. The controls and mitigants are not abstractions; they are strategic imperatives an operating leader can own, sequence, and be measured against. The World's Most Productive Companies tend to treat them as part of how the business is run, while companies earlier in the progression tend to treat them as projects to address later.
COO Strategic Imperatives
This is the focus of the LNS Research COO Council. The objective is not to chase a benchmark for its own sake, but to define and enable the strategic imperatives that allow an operating leader to build a durable productivity advantage, and over time to operate as a Market-Shaping Enterprise that uses consistent industrial productivity growth to influence the standards, expectations, and behaviors of its market rather than only responding to them.
Two Practical Next Steps
The 2025 improvement is an opportunity to act from a more stable starting point. There are two practical next steps for an operating leader.
Benchmark your industrial productivity against the World's Most Productive Companies in your industry and peer group, to see where the operating model is gaining ground and where it is losing it. Meet the 2026 World's Most Productive Companies
Embed the Risk-Centric Causal Network in your own enterprise's environment and context, as critical decision infrastructure to build your industrial operations strategy and support a successful industrial AI transformation.
All entries in this Industrial Transformation blog represent the opinions of the authors based on their industry experience and their view of the information collected using the methods described in our Research Integrity. All product and company names are trademarks™ or registered® trademarks of their respective holders. Use of them does not imply any affiliation with or endorsement by them.
Subscribe Now
Become an LNS Research Member!
As a member-level partner of LNS Research, you will receive our expert and proven Advisory Services. These exclusive benefits give your team:
Regular advisory sessions with our highly experienced LNS Research Analysts
Access to the complete LNS Research Library
Participation in members-only executive Roundtable events
Important, continuous knowledge of Industrial Transformation (IX)
Let us help you with key decisions based on our solid research methodology and vast industrial experience.
Discover three strategic pathways to industrial productivity growth with insights from First Solar, Pilgrim’s Pride, and Linde's success stories.
Vivek Murugesan
Feb 10, 2026
SUBSCRIBE TO THE LNS RESEARCH BLOG
Stay on top of the latest industrial transformation insights from our expert analysts
The Industrial Transformation and Operational Excellence Blog is an informal environment for our analysts to share thoughts and insights on a range of technology and business topics.