The Industrial Productivity crisis is real.
Four megatrends in recent years have revealed that global industrial productivity has been declining and flatlining. To begin with, the skilled workforce shortage has become pervasive across nearly every sector in manufacturing today, with the average tenure of a front-line worker down to 3 years from 20 years in 2019.
At the same time, asset, product, and process complexities have grown significantly, particularly in consumer-facing industries. Additionally, COVID-19 further exposed how fragile globally optimized supply chains had become, revealing that efficiency often came at the cost of resilience. And finally, the rapid arrival of artificial intelligence is forcing manufacturers to invest substantial resources in redefining operating models that enable faster decision-making across the organization.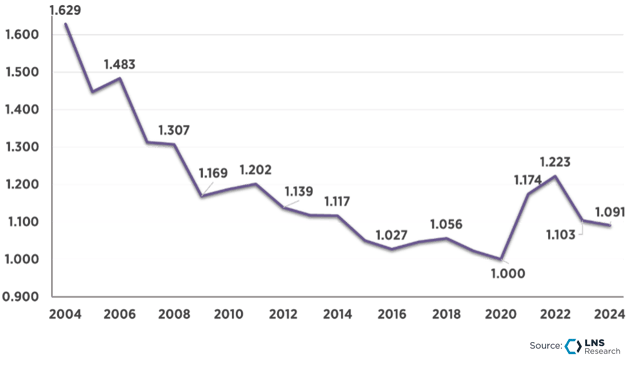
These megatrends are prompting manufacturers to reassess productivity to do more with less. However, the fundamental challenge remains in measuring productivity itself. As my colleague Niels Andersen often quotes Lord Kelvin, “You cannot improve what you cannot measure.” Most productivity analyses focus only on labor productivity or isolate a single segment of the industrial landscape. What we lack is one consistent, reliable, and comprehensive way to measure productivity across industries and the full value chain.
In this blog post, we’ll take a closer look at the Industrial Productivity Index (IPI) — LNS Research’s benchmark for addressing this gap — and examine what it reveals about the true state of productivity today.
The Two Pillars of the LNS Research Industrial Productivity Model:
The LNS Research Industrial Productivity Index builds on two well-established economic foundations: the Endogenous Growth Theory and Total Factor Productivity (TFP). Let’s take a look at them and how the LNS Research model is built around them.
- Endogenous Growth Theory: Productivity Starts From Within
 Endogenous growth theory, recently recognized with the Nobel Prize in Economics this year, demonstrates that long-term economic growth is not primarily driven by external forces such as market cycles or natural resource availability. Instead, it stems from internal dynamics: human capital development, technological innovation, strategic investments, and the ability of organizations to continually learn and scale new capabilities.
When applied to manufacturing, this theory reinforces an important insight: productivity is not something that is achieved as a result of market dynamics and economic conditions; it is something actively brought about with improvements in workforce skills, technology adoption, process innovation, and organizational design. In other words, manufacturers that invest purposefully in their people, processes, and technology are those that improve efficiency, grow profitably, and remain competitive over time.
- Total Factor Productivity: Beyond Just Labor Productivity
Total Factor Productivity (TFP) expands this view. TFP argues that productivity growth is shaped by five major factors: Business Cycles, Technology Adoption, Innovation Intensity, Workforce Capability and Availability, and Management Strategy and Effectiveness. Essentially, this highlights that overall productivity depends on more than just labor or capital; it reflects how effectively a company combines all its inputs.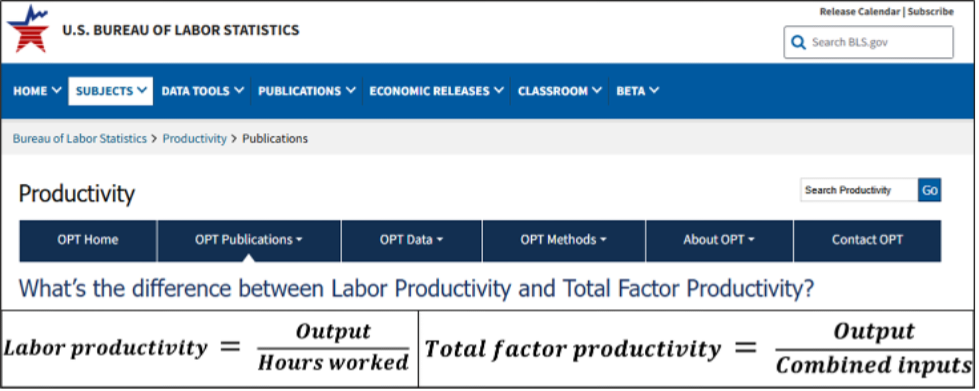
Total Factor Productivity has historically been used to measure U.S. economic growth, and while widely valuable, it is not designed to capture the full complexity of global industrial operations. It provides insight into national trends but does not fully account for global supply chains that stretch across continents, product mixes that vary widely even within industries, and pricing dynamics across product categories.
The LNS Research Industrial Productivity Index builds on these two frameworks, but adapts them to the complexity of modern, global manufacturing. By integrating the principles of endogenous growth theory with the multi-factor lens of TFP, and applying them beyond a single national economy, we have a model suited to today’s industrial scenario.
LNS Research defines industrial productivity as the ratio of output delivered to inputs consumed, where outputs are the value-adjusted delivery of products and services to customers and inputs are the value-adjusted consumption of labor, materials, energy, assets, and logistics used to deliver those products and services.
While the concept is straightforward, accurately measuring input and output quantities is quite complex. There is no way to directly measure these operational quantities accurately across even a single company, never mind the entire economy. However, there is a way to indirectly measure the changes to these operational quantities through financial data.
To calculate industrial productivity growth in the world of operations, there are three pieces of required financial data:
Using financial data, we can use dollars as a common unit across all output and input categories. Then, when we can control for and back out average price changes year-over-year across all categories, all that remains are real-world operational changes to the value-adjusted quantity of outputs and inputs.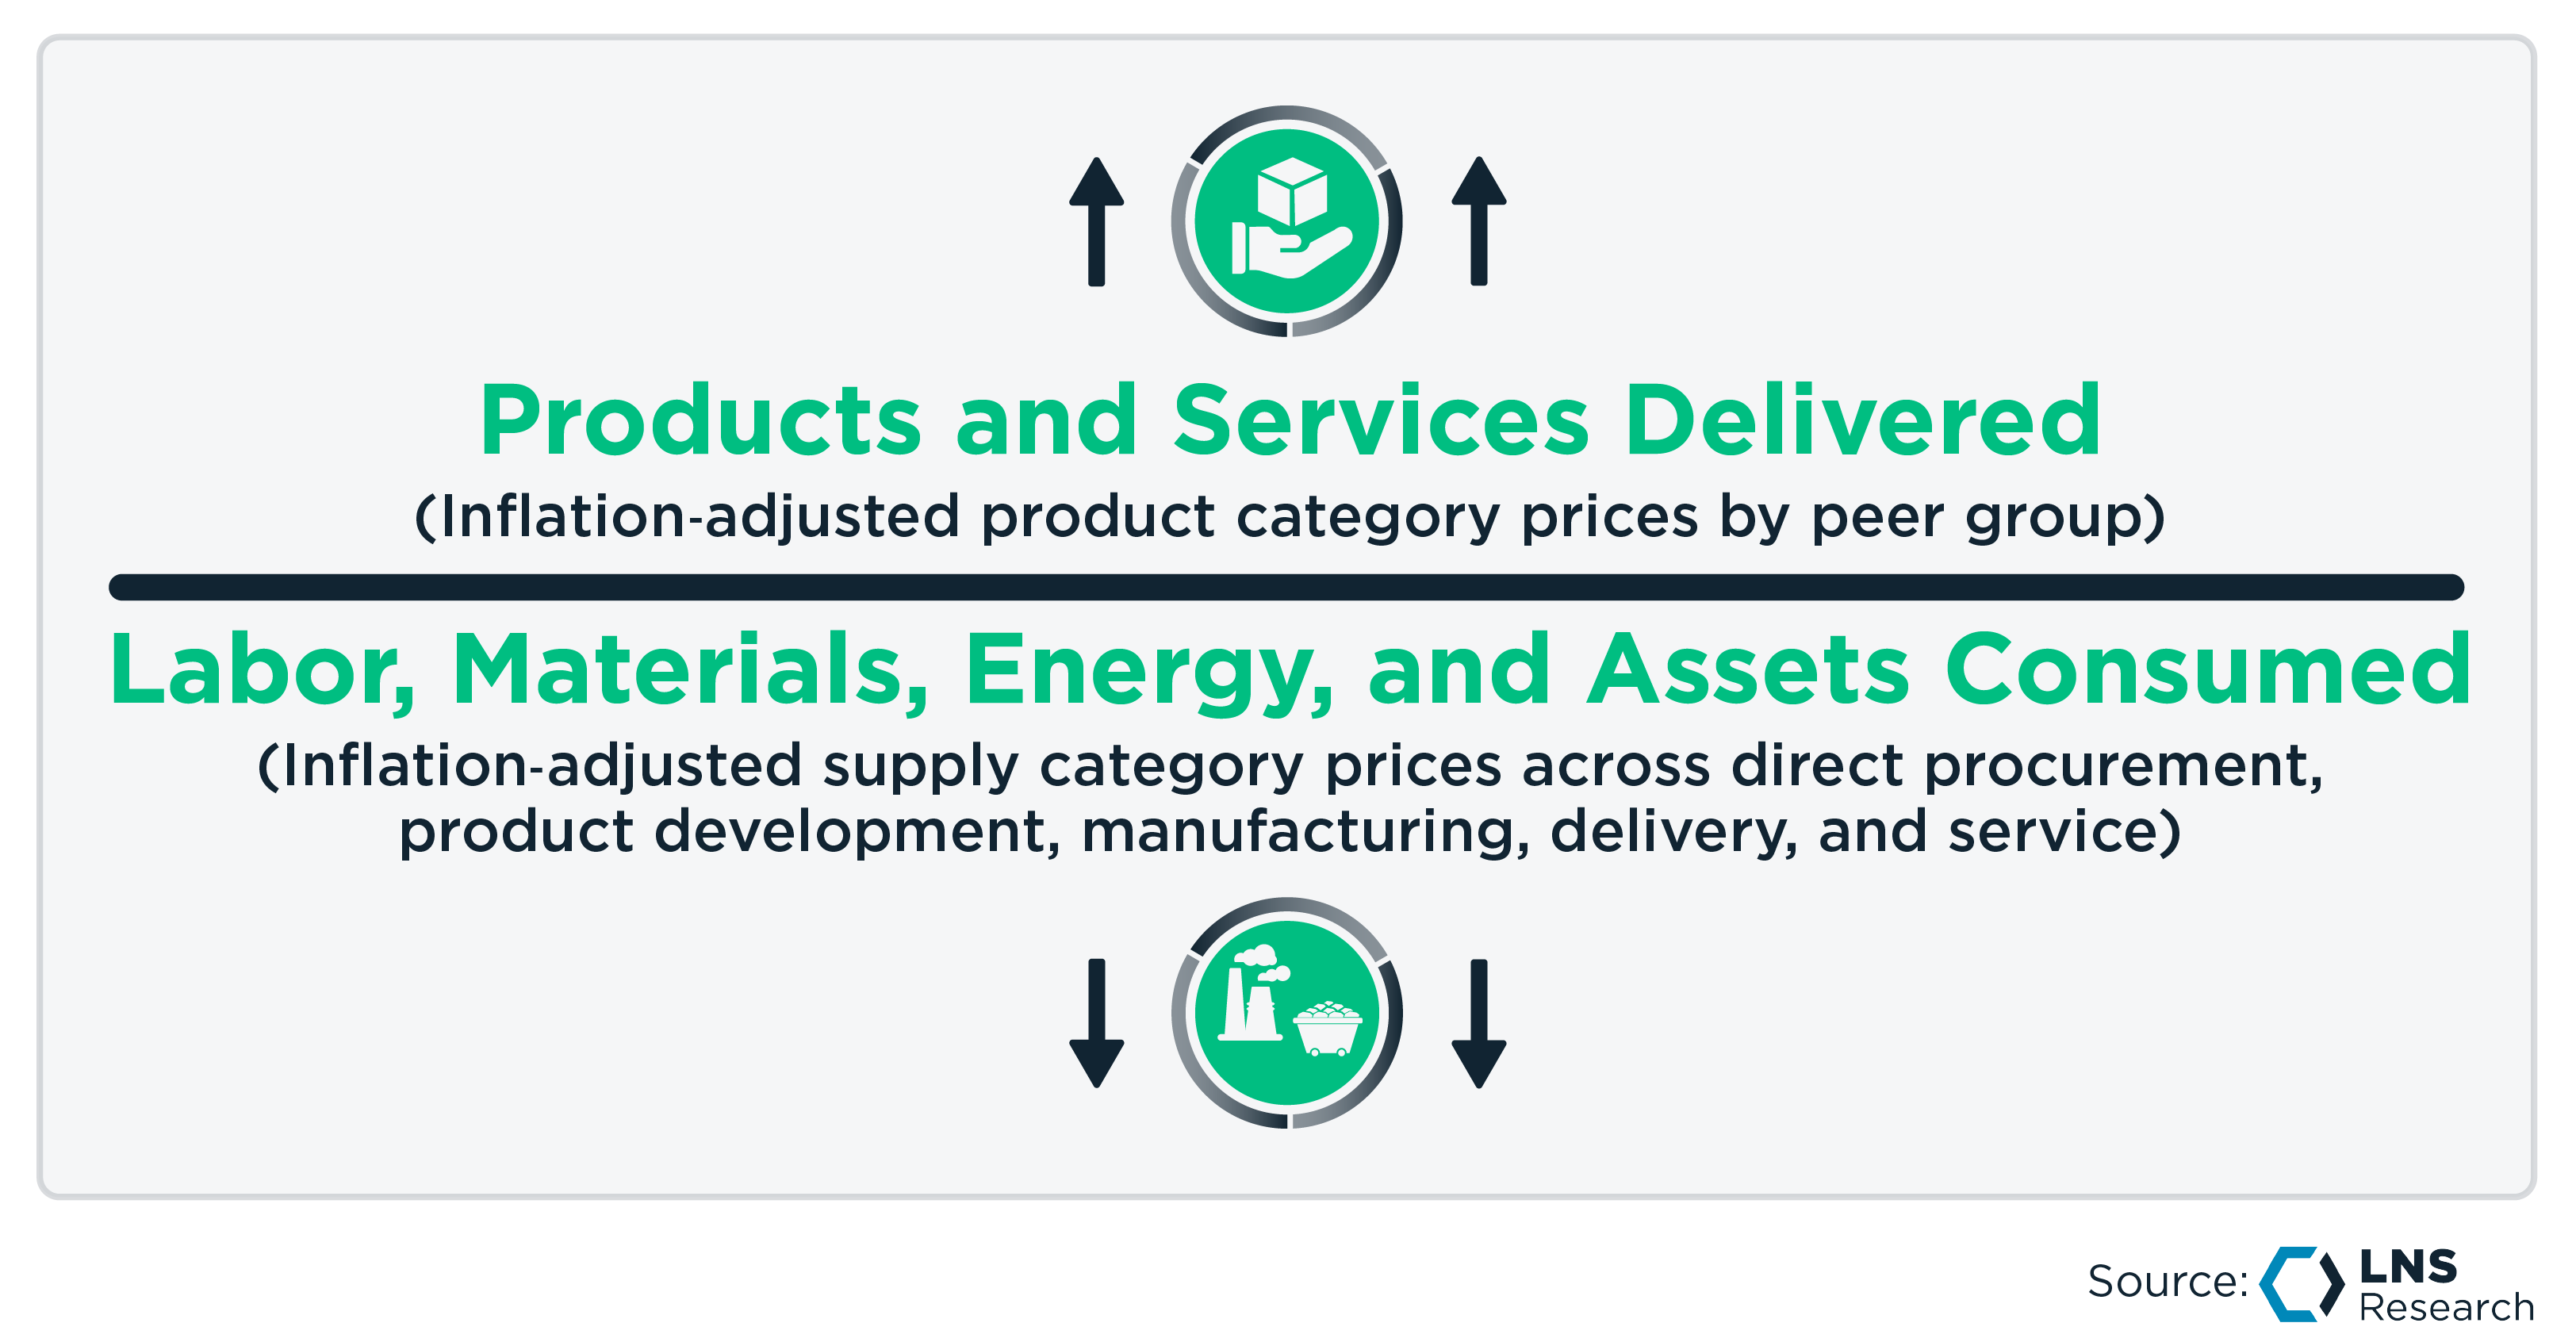
This approach allows us to measure productivity across industries, geographies, and the end-to-end value chain, providing a more accurate and comparable view of how efficiently companies transform inputs into outputs.
A Real-World Example of Calculating the Industrial Productivity Index: General Mills
We begin with General Mills' financial data for a particular year, let’s say, 2024. To that, we apply producer price indices for General Mills’ product categories to account for price changes. It is important to note that the price changes were not made at the overall food industry level but were calculated as a weighted average based on the contribution of each of its product categories.
General Mills Product Categories:
- Breakfast Cereal: (Approx. 20% of revenue)
- Output: Breakfast Cereal
- Input: Farm Product Commodities (Grains), Sugar
- Snacks, Packaged Food, and Confectionery: (Approx. 50% of revenue)
- Output: Fruit and Vegetable Preserving, Specialty Food, Sugar and Confectionery Products, Other Snack Foods
- Input: Farm Product Commodities (Fruits and Melons, Fresh/Dry Vegetables, and Nuts), Farm Product Commodities (Grains), Flavoring Syrup, and Concentrate
- Pet Food: (Approx. 10% of revenue)
- Output: Animal Food
- Input: Animal Slaughtering and Processing, Farm Product Commodities (Grains), Fruit and Vegetable Preserving, Specialty Food
- Dairy Products: (Approx. 10% of revenue)
- Output: Dairy Products
- Input: Farm Product Commodities (Raw Milk), Processed Food and Feed Commodities (Sugar and Confectionery)
- Food Service and Other: (Approx. 10% of revenue)
*Product category breakdowns are estimated based on publicly available information
We adjust General Mills’ 2024 revenue by a weighted average of the output prices and COGS by a weighted average of the input prices for each product category. After this, we account for additional inputs like assets, energy, labor, packaging, etc., and then divide this adjusted revenue by the adjusted COGS to give General Mills’ productivity number, which is then indexed to its 2019 counterpart to get the final Industrial Productivity Index for 2024.
However, to get a full picture of General Mills’ performance, we need to view its IPI performance alongside its financials and market price changes. To begin with, General Mills’ financial data during the last five-year period shows that both revenue and COGS have risen steadily — up 18% and 16% respectively since 2019 — before experiencing a slight decline from 2023 to 2024.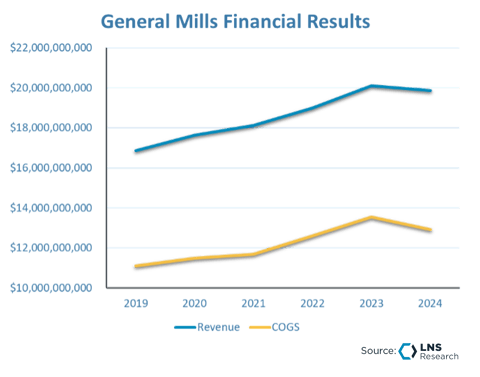
On the other hand, when we look at market conditions, inflation has been a net detriment for General Mills. Its output prices — the prices at which it sells products — have increased at roughly twice the rate of its input prices, the prices it pays to suppliers.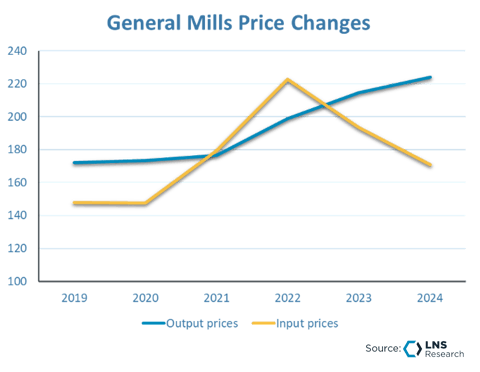
Accounting for price changes, we can take a closer look at General Mills’ path to productivity. During the five-year period, its output delivered fell by 9%, while its inputs remained essentially flat, rising only about 1%. In other words, the company produced 9% less with roughly the same level of resources.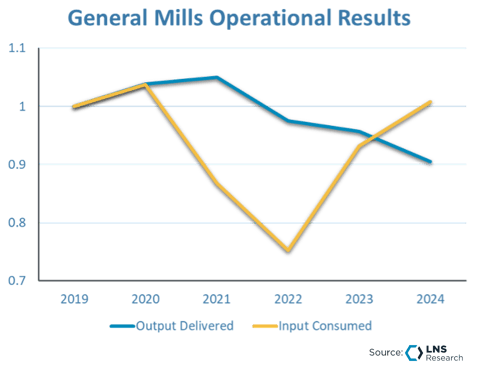
Viewed in isolation, these numbers don’t tell the whole story of its productivity growth, because they need to be compared against its branded packaged food peers, a sector that has struggled overall. From 2019 to 2024, the peer group’s productivity declined by 13%, meaning General Mills performed comparatively better than its competitors to become one of the World’s Most Productive Companies (WMPC) in the Branded Packaged Foods sector.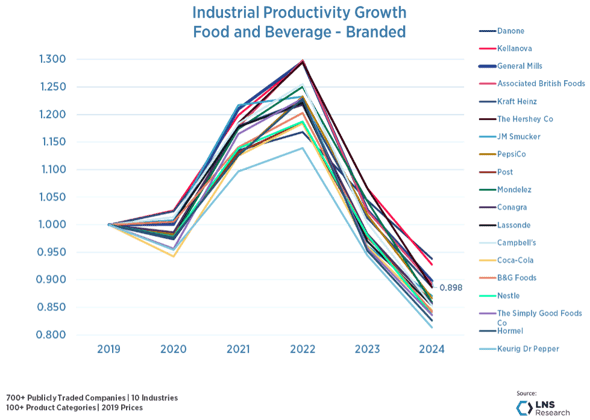
Summary & Recommendations:
As manufacturers look ahead to 2026 and begin shaping medium and long-term plans, it’s clear they are entering a decisive moment of the industrial productivity crisis and facing the need to build the cornerstone for an AI-first industrial world. The way companies respond now could make or break their competitiveness, especially as early movers stand to gain disproportionate advantage in an increasingly winner-take-all environment.
The LNS Research Industrial Productivity Index offers a framework built for this new reality. By grounding the model in established economic theory and extending it with a rigorous, data-driven method to isolate real operational changes, the IPI provides a clearer view of how effectively companies convert inputs into outputs. In a period defined by AI acceleration and global volatility, this level of clarity is no longer optional. It is the foundation for making smarter investments, building more resilient operations, and ultimately restoring long-term industrial productivity growth.
If you are a technology or business leader in an industrial organization navigating these challenges, I strongly encourage you to recognize the productivity crisis, understand the differences across industries, and learn from the companies that are pulling ahead. Here are several best-practice recommendations from this research:
-
-
-
Industrial Productivity is not just labor productivity. One of the most commonly cited measures of productivity is labor productivity. While labor is important, it is not a reliable proxy for overall industrial productivity. True productivity spans both factory operations and everything that happens outside the plant — how efficiently companies manage energy, supplier relationships, logistics, delivery, and more. Industrial productivity should reflect how effectively all inputs across the value chain are converted into outputs.
-
Make Things Different. One of the defining characteristics of WMPCs and Productivity Pathfinders is their willingness to rethink how they operate. This goes beyond digitizing existing processes; it involves reimagining product mixes, redesigning processes, and reshaping operating models to create lasting competitive advantage. Case studies of WMPCs show that this ability to “make things different” is a critical enabler of sustained productivity growth.
-
A Collaborative Supply Chain Beats a Competitive Supply Chain. Another key differentiator among WMPCs and Productivity Pathfinders is how they engage suppliers and customers. Many manufacturers still operate within adversarial or purely transactional supply chain relationships, sharing limited data and optimizing only their own operations. In contrast, the most productive companies treat suppliers and customers as true partners, openly sharing not just data but insights, aligning on goals, and working together to improve the performance of the entire value chain.