We hear many of our member companies tout predictive analytics capabilities and insights. Predicting a problem is great and an expected result from an Industrial Transformation (IX) program that is less than halfway through the journey of Advanced Analytics. Application of prognostic analysis practices leads to a re-examination of the traditional Cost of Quality framework and the potential realization of a long-sought ideal in the Quality profession; Zero Defects.
LNS Research defines the Analytics Framework (Figure 1) as a six-stage journey beginning with descriptive and ending with Self-Learning Prognostic Analytics.
Figure 1
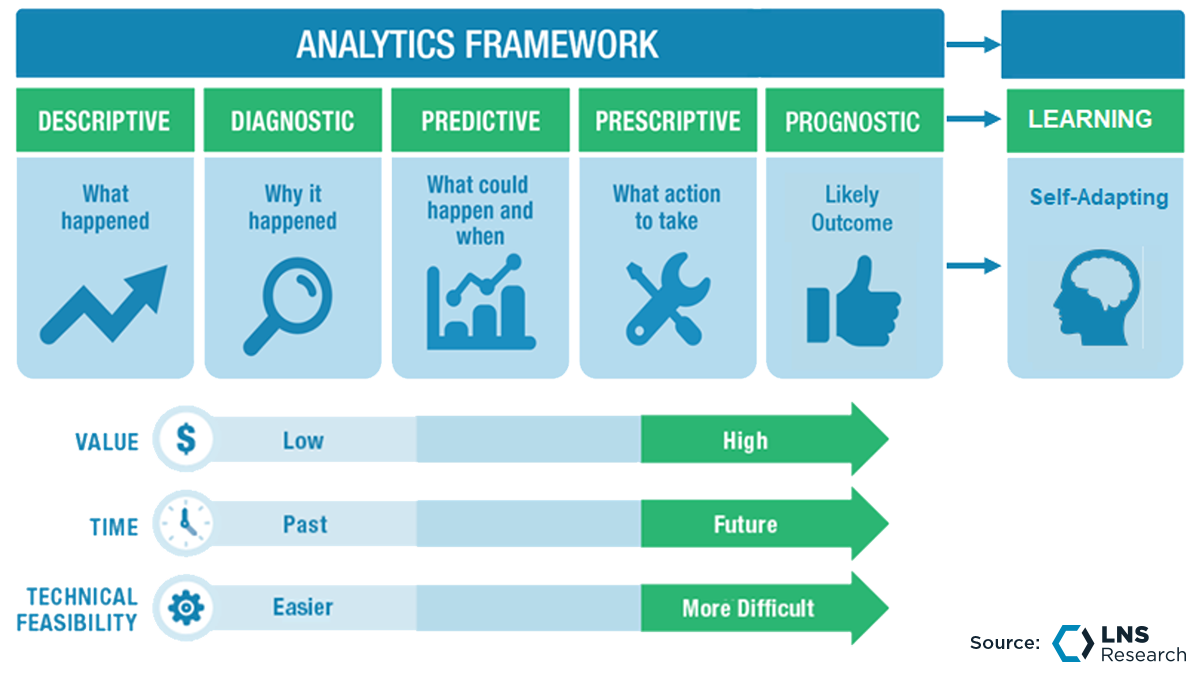
Let's talk about each stage, within the context of Quality in an organization.
Descriptive Analytics:
Descriptive Analytics is as the name suggests...descriptive. It describes a data set of interest. For example, if we wanted to know how many rejects happened in a given unit of time, this is an aspect of Descriptive Analytics. Simply, descriptive analytics tell us WHAT happened.
Diagnostic Analytics:
Diagnostic Analytics go further than description to give us more context about the WHAT from Descriptive Analytics. Diagnostics of our rejects from the example given above would tell us about the reasons for rejection. Diagnostic Analytics tells us WHY it happened.
Predictive Analytics:
Prediction has been around for quite a while. Stock market players use prediction to inform their decisions about what to buy and sell. Predictive Analytics tells us the WHEN about the WHAT and WHY. Predictive Analytics on our known rejects from our example would tell us, based on a pattern of past rejection, WHEN the next rejection is likely to occur.
Prescriptive Analytics:
Prescribing is about action. Prescription is the WHAT TO DO about the WHAT, WHY, and WHEN. Prescriptive Analytics is based on past patterns of action. When our analytics package sees the reject occur, for a certain reason, based on the ways it has been responded to in the past, actions are recommended to recover/restore. Up to this point in our Analytics journey, everything has been backward-looking and based on history. Sort of like trying to drive using the rear-view mirror. For our reject, Prescriptive Analytics tells us WHAT TO DO when the reject happens.
Prognostic Analytics:
Prognosis takes all the things we have done up to this point in our journey and flips them around to look into the future and answer the question, "How do I prevent it from happening?" In our reject example, Prognostics would monitor the key process variables that contribute to the reject and flag a change in process variables that would likely produce the defect. Prognostic Analytics tells us HOW DO I PREVENT it from happening.
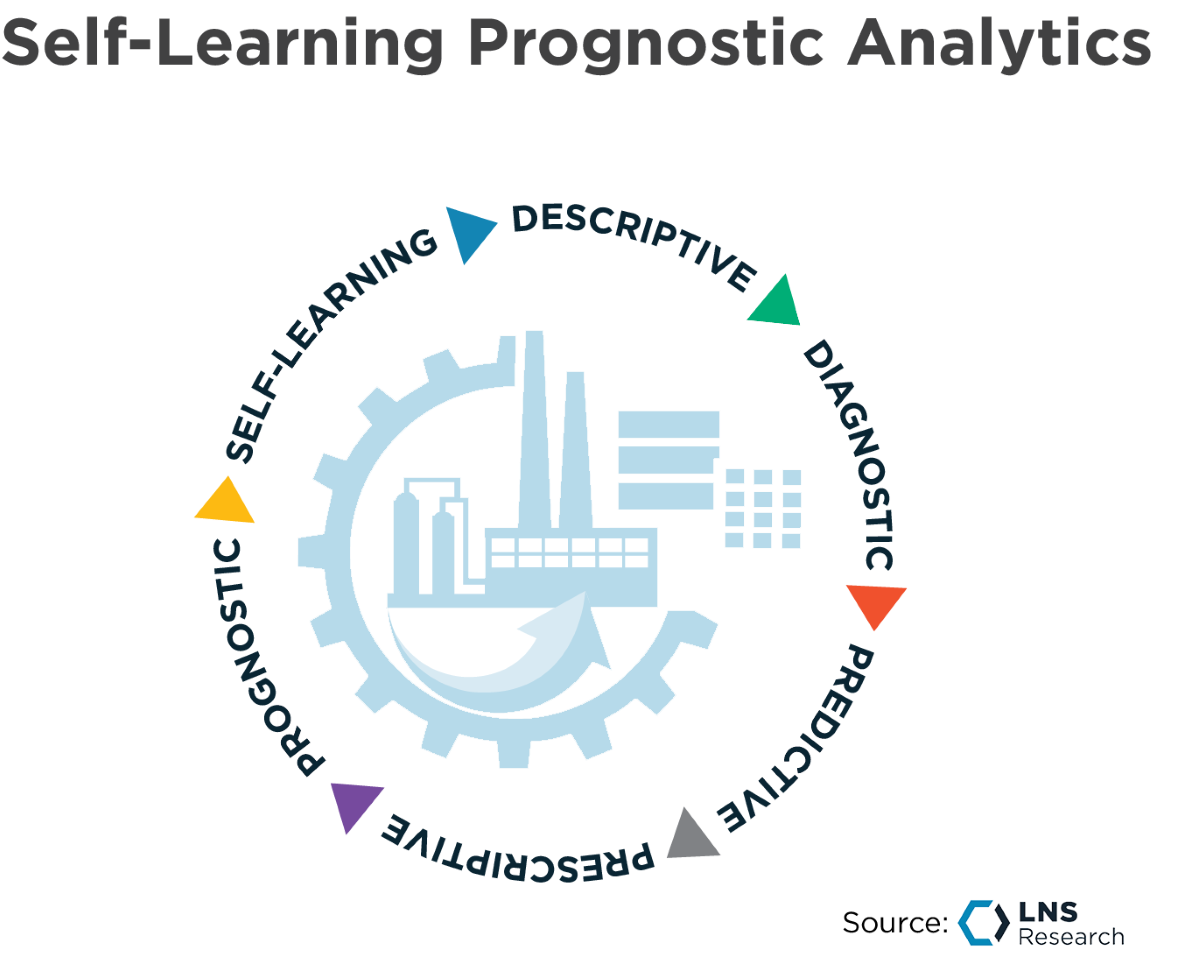
Self-Learning Prognostic Analytics:
Self-Learning Prognostics takes everything we have learned up to this point in our Analytical journey and adds modeling to it to answer the question, "WHERE are there similar processes that this learning can be applied to?"
Figure 2
It is in the pivot to future-looking prognosis and self-learning prognosis where companies can achieve greater reductions in their Cost of Quality performance than ever before (Figure 2). Cost of Quality has been an accepted set of Quality metrics for nearly a century now. There is a rule of thumb inherent within the Cost of Quality framework that we should now re-examine.
The 1-10-100 rule describes the cost to an organization associated with their Quality actions and behaviors. By looking at prognostics and a learning system, we can begin to see if our heuristics and rules of thumb are accurate or not - and change our decision-making. The 1-10-100 rule came about well before low-cost sensors, vision systems, globalization, and social media. So, what used to be true may actually now be closer to 1-1,000-100,000 as the cost of inspection continues to go down and the cost of an escaped non-conformance continues to go up.
We see through our research on Quality 4.0 Maturity, conducted last year, that this is in fact true.
Figure 3
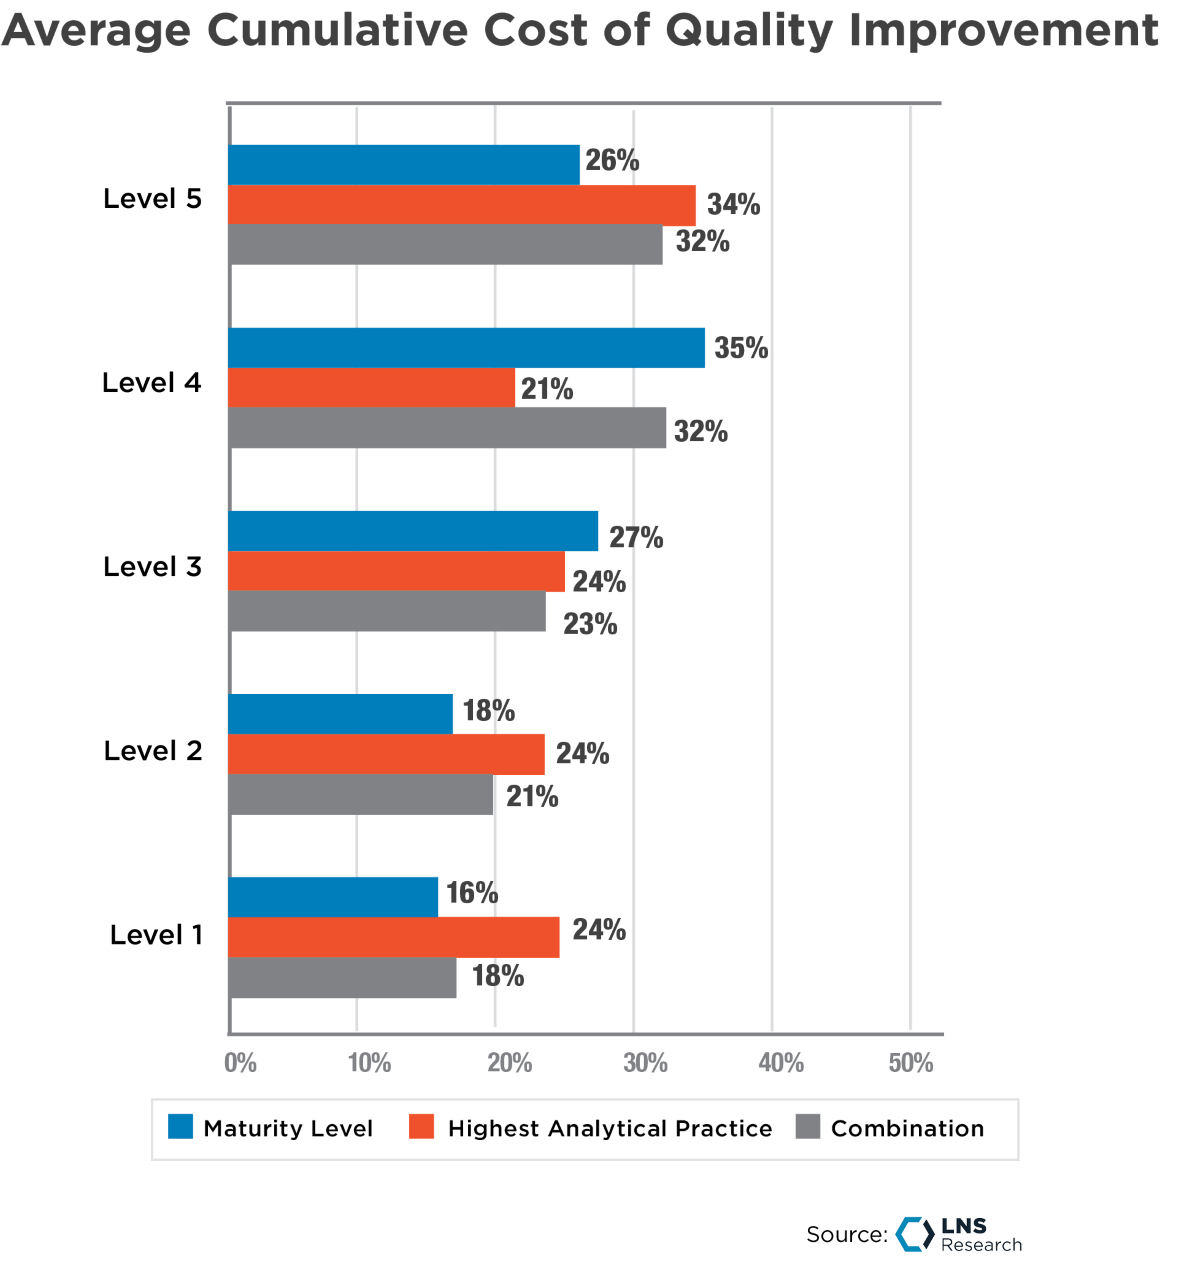
Those who reported Prognostic Analytics practices (Level 5) in the survey, reported 38% better results across sixteen KPIs than those reporting a Predictive Analytics practice (Level 3), as shown in figure 3 above.
Most companies that measure Cost of Quality do not do a good job of capturing costs that are not directly on the Profit and Loss statements. An example of this is Warranty Reserves. For a product company, this is a line item and if warranty issues are frequent, these are well captured, easy to measure, understand, and manage. For a Food & Beverage company, where recalls and warranties are far less frequent, these costs are likely not as well captured, measured, understood, or managed.
There is a significant cost that comes with rising to prominence in the age of social media that is not well measured or understood, reputation. Reputation in the market can make or break a company in real dollar value. Think about the Enron’s, Boeing’s, or Takata’s of the world. When those companies experienced issues in the market it most certainly affected revenue, even survival in Enron’s case. Weber-Shandwick reported in 2020 that one point of reputation for a $100 million company is worth $630,000 and 5% to 9% of sales. If we add the cost impacts of reputation in the market, recalls, litigation, etc. the large end of the rule for Cost of Quality can be extended.
Figure 4
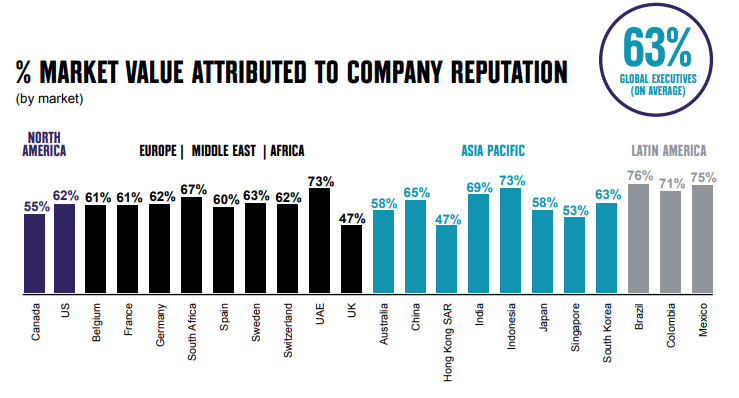 Source: Weber-Shandwick
Improvement in KPIs across the business, not just traditional measures of Quality, leads to the second aspect of our re-examination of the Cost of Quality. Traditional Cost of Quality is a dated ideal with negative connotations, too often meaning Cost of the Quality function. An expanded view of the Cost of Quality model should include those “other” cost impacts that suffer when poor quality occurs and benefit when things are running well.
The results from our Quality 4.0 Maturity Study show that Quality impacts many other parts of the company, both positively and negatively. The cost of a Quality reputation is dependent on several factors, including achieving the lowest level of Quality-related issues and applying resources in the right place at the right time to achieve a good Quality reputation in the market.
Cost of Quality is due for a refresh. By leveraging Prognostic Analytics and insights the Good Quality side of the equation can be further enhanced without additional investment. When prognostic analysis and insights are applied rigorously, the long-sought dream of “Zero Defects” is in sight. So, while 1-10-100 used to be true, now it is closer to 1-1,000-100,000 as inspection is easier and the application of Advanced Analytics can tell us where to prevent similar problems and the cost to reputation continues to go up.
Quality leaders are challenged to couch quality issues and concerns in terms that company executive leaders can relate to. A dynamic, holistic, near-real-time Cost of Quality that is tied strongly to business results goes a long way toward creating that framework for consistency of decision making and consistency of action that VPs of Quality are looking for. Cost of Quality needs to move closer to real-time to be relevant to the business. In the digital age, Quality IT professionals can take great strides toward embedding Cost of Quality within the digital tools of a Quality 4.0 program.
Some things to consider:
-
-
-
Apply Prognostic Analytics to forward-looking risk scenarios to create a “Live Risk Matrix.”
-
Apply Customer Data in combination with Manufacturing and Quality Data to build “likely escape scenarios” to populate that Risk Matrix.
-
Build live dashboards for Cost of Quality elements so the effects of decision-making can be seen at or near the moment.
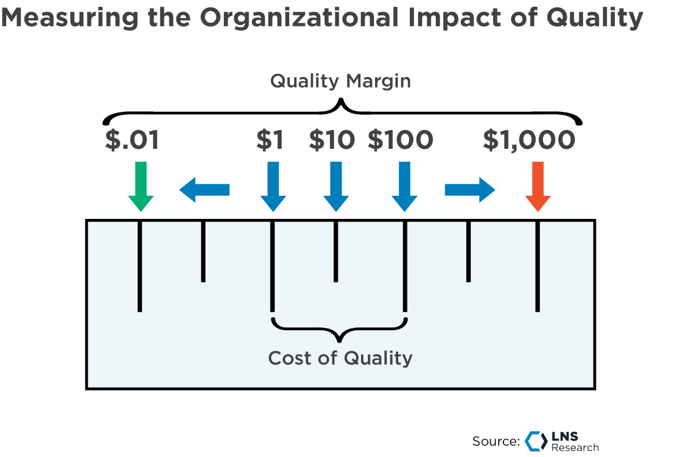
More than just a name change, the new ideal for measuring the impact of Quality on the organization, both positive and negative, should be thought of as “Quality Margin” (Figure 5) to reflect an emphasis on the profitability of a good Quality reputation and well-executed Quality strategy towards “Quality as a Value” rather than Quality as a job title.
Figure 5
In the near, we will be conducting some research in the Continuous Improvement/Operational Excellence space, in which we will explore these ideas further. Stay tuned for more to come.

All entries in this Industrial Transformation blog represent the opinions of the authors based on their industry experience and their view of the information collected using the methods described in our Research Integrity. All product and company names are trademarks™ or registered® trademarks of their respective holders. Use of them does not imply any affiliation with or endorsement by them.
